Hinweis
Der Websiteadministrator muss code scanning aktivieren, damit du dieses Feature verwenden kannst. Wenn du GitHub Actions zum Überprüfen deines Codes verwenden möchtest, muss der Websiteadministrator auch GitHub Actions aktivieren und die erforderliche Infrastruktur einrichten. Weitere Informationen finden Sie unter Konfigurieren der Codeüberprüfung für Ihre Anwendung.
About your code scanning configuration
You can use a variety of tools to configure code scanning in your repository. For more information, see Konfigurieren des Standardsetups für das Codescanning and Konfigurieren des erweiterten Setups für das Codescanning.
The log and diagnostic information available to you depends on the method you use for code scanning in your repository. You can check the type of code scanning you're using in the Security tab of your repository, by using the Tool drop-down menu in the alert list. For more information, see Assessing code scanning alerts for your repository.
About analysis and diagnostic information
You can see analysis and diagnostic information for code scanning run using CodeQL analysis on GitHub.
Analysis information is shown for the most recent analysis in a header at the top of the list of alerts. For more information, see Assessing code scanning alerts for your repository.
Diagnostic information is displayed in the Action workflow logs and consists of summary metrics and extractor diagnostics. For information about accessing code scanning logs on GitHub, see Viewing the logging output from code scanning below.
If you're using the CodeQL CLI outside GitHub, you'll see diagnostic information in the output generated during database analysis. This information is also included in the SARIF results file you upload to GitHub with the code scanning results.
For information about the CodeQL CLI, see Analysieren des Codes mit CodeQL-Abfragen.
About summary metrics
Zusammenfassungsmetriken enthalten Folgendes:
- Codezeilen in der Codebase (als Baseline) vor Erstellung und Extrahierung der CodeQL-Datenbank
- Codezeilen in der CodeQL-Datenbank, die aus dem Code extrahiert wurden, einschließlich externer Bibliotheken und automatisch generierter Dateien
- Codezeilen in der CodeQL-Datenbank ohne automatisch generierte Dateien und externe Bibliotheken
About CodeQL source code extraction diagnostics
Die Extraktordiagnose deckt nur Dateien ab, die während der Analyse ermittelt wurden. Metriken:
- Anzahl erfolgreich analysierter Dateien
- Anzahl von Dateien, die während der Datenbankerstellung Extraktorfehler generiert haben
- Anzahl von Dateien, die während der Datenbankerstellung Extraktorwarnungen generiert haben
You can see more detailed information about CodeQL extractor errors and warnings that occurred during database creation by enabling debug logging. For more information, see Protokolle sind nicht detailliert genug.
Viewing the logging output from code scanning
This section applies to code scanning run using GitHub Actions (CodeQL or third-party).
After configuring code scanning for your repository, you can watch the output of the actions as they run.
-
Klicke unter dem Repositorynamen auf Actions.

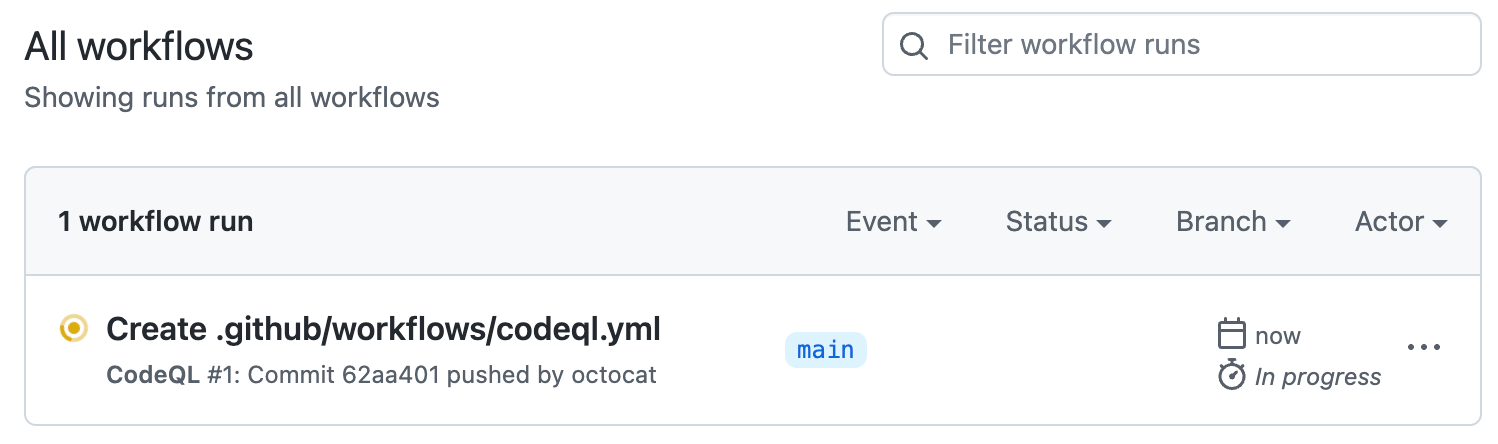
You'll see a list that includes an entry for running the code scanning workflow. The text of the entry is the title you gave your commit message.
-
Click the entry for the code scanning workflow.
Hinweis
If you are looking for the CodeQL workflow run triggered by enabling default setup, the text of the entry is "CodeQL."
-
Click the job name on the left. For example, Analyze (LANGUAGE).

-
Review the logging output from the actions in this workflow as they run.
-
Optionally, to see more detail about the commit that triggered the workflow run, click the short commit hash. The short commit hash is 7 lowercase characters immediately following the commit author's username.
-
Once all jobs are complete, you can view the details of any code scanning alerts that were identified. For more information, see Assessing code scanning alerts for your repository.


