![]()
Visualize OnlineTechnicalIndicators.jl using LightweightCharts.jl.
using OnlineTechnicalIndicators
using TechnicalIndicatorCharts

golden_cross_chart = Chart(
    "AAPL", Week(1);
    indicators = [
        SMA{Float64}(;period=50),         # Setup indicators
        SMA{Float64}(;period=200)
    ],
    visuals = [
        Dict(
            :label_name => "SMA 50",      # Describe how to draw indicators
            :line_color => "#E072A4",
            :line_width => 2
        ),
        Dict(
            :label_name => "SMA 200",
            :line_color => "#3D3B8E",
            :line_width => 5
        )
    ]
)Adding new data to the chart is done with the update!(chart, candle) function.
using MarketData

for row in eachrow(AAPL)
    c = Candle(
        ts=DateTime(row.timestamp),
        o=row.Open,
        h=row.High,
        l=row.Low,
        c=row.Close,
        v=row.Volume
    )
    update!(golden_cross_chart, c)
end
Notice that update! took daily candles from AAPL and aggregated them into weekly candles.
The
update!function was designed to consume low timeframe candles to incrementally build higher timeframe charts. Imagine unfinished 1m candles from a websocket being consumed to generate multiple higher-timeframe charts for the same market. The hope was that this would facilitate realtime, multi-timeframe analysis.
The visualize function will take a chart and generate something that lwc_show from LightweightCharts.jl can display.
using LightweightCharts

lwc_show(visualize(golden_cross_chart))
# Or
golden_cross_chart |> visualize |> lwc_show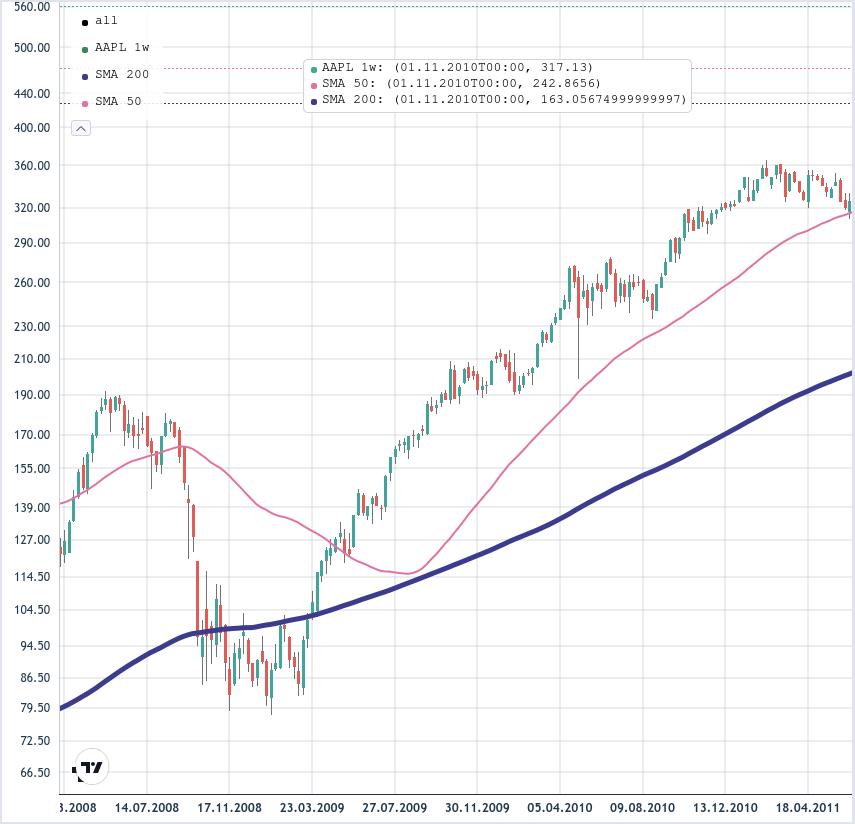
- AccuDist
- ADX
- ALMA
- AO
- Aroon
- ATR
- BB
- BOP
- CCI
- ChaikinOsc
- ChandeKrollStop
- CHOP
- CoppockCurve
- DEMA
- DonchianChannels
- DPO
- EMA
- EMV
- ForceIndex
- HMA
- KAMA
- KeltnerChannels
- KST
- KVO
- MACD
- MassIndex
- McGinleyDynamic
- MeanDev
- OBV
- ParabolicSAR
- PivotsHL
- ROC
- RSI
- SFX
- SMA
- SMMA
- SOBV
- STC
- StdDev
- Stoch
- StochRSI
- SuperTrend
- T3
- TEMA
- TRIX
- TrueRange
- TSI
- TTM
- UO
- VTX
- VWAP
- VWMA
- WMA
- ZLEMA
See Also: Indicators support - OnlineTechnicalIndicators.jl
Help Wanted: Visualization Function Writers