-
Notifications
You must be signed in to change notification settings - Fork 67
New issue
Have a question about this project? Sign up for a free GitHub account to open an issue and contact its maintainers and the community.
By clicking “Sign up for GitHub”, you agree to our terms of service and privacy statement. We’ll occasionally send you account related emails.
Already on GitHub? Sign in to your account
Possible memory leak when calling solver.run multiple times #380
Comments
|
Is it specific to LBFGS or does it happen with any solver? |
|
Hi, I have experienced the issue with LBFGS and GradientDescent. The increase in memory is less evident with GradientDescent, but it is still there. I believe the issue does not depend on the solver. |
|
Setting |
|
I don't have a solution for this, but can confirm that it happens also with the |
|
Some updates on my investigations.
However, if I uncomment the lines inside the for loop (even for just 1 iteration), the leak comes back |
|
In your example, is there still a leak if the update is not jitted? |
|
Thanks for the investigations. I would like to know whether this behavior can be considered as a bug and whether there is any plan to fix it. |
|
Yes to both. Seems like a bug and should be fixed (although we're all
spread too thin, I wouldn't know how to set a timeline on it)
…On Thu, Feb 23, 2023, 09:49 Alessandro Lucantonio ***@***.***> wrote:
Thanks for the investigations. I would like to know whether this behavior
can be considered as a bug and whether there is any plan to fix it.
—
Reply to this email directly, view it on GitHub
<#380 (comment)>, or
unsubscribe
<https://github.com/notifications/unsubscribe-auth/AACDZB3HYXKRYPU5PVS3UVTWY4QAHANCNFSM6AAAAAAT62H7U4>
.
You are receiving this because you were mentioned.Message ID:
***@***.***>
|
|
Hi, has been there any progress on this issue? |
|
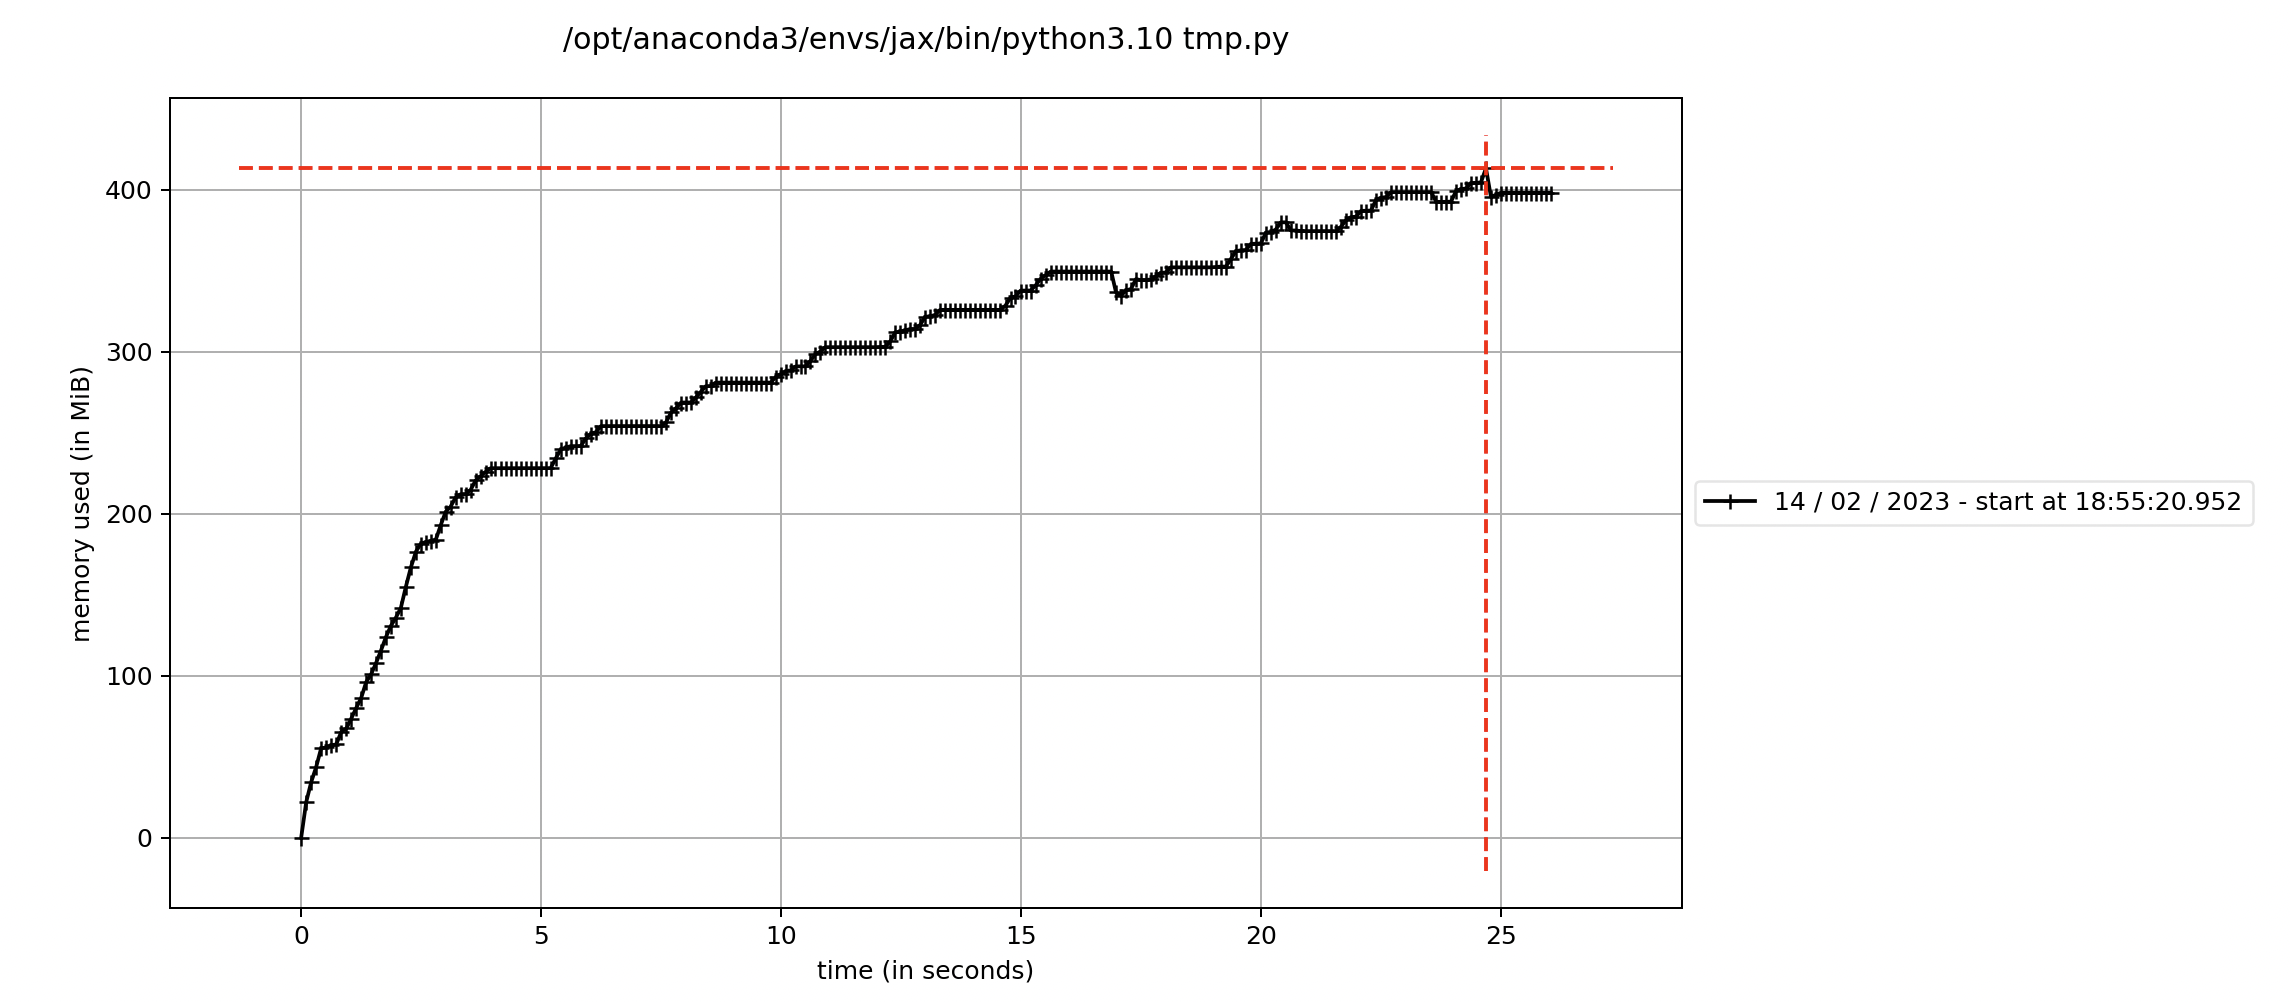
This behavior can be avoided using the newly implemented For example, the code below doesn't have the ever increasing profile. Instead, it has the more expected initial increment and then plateau: |
|
I'm going to close the issue for now, but please reopen if problem persist (BTW you might need the development version of jax for the clear_caches() function) |
|
It's nice to have a workaround but shouldn't garbage collection be able to do this automatically? |
|
Maybe, but at this point it seems more of an issue concerning jax than
jaxopt, wdyt?
…On Fri, May 19, 2023, 11:30 Mathieu Blondel ***@***.***> wrote:
It's nice to have a workaround but shouldn't garbage collection be able to
do this automatically?
—
Reply to this email directly, view it on GitHub
<#380 (comment)>, or
unsubscribe
<https://github.com/notifications/unsubscribe-auth/AACDZB5LS6WPDJW3J2VE6BLXG44RZANCNFSM6AAAAAAT62H7U4>
.
You are receiving this because you modified the open/close state.Message
ID: ***@***.***>
|
|
Agreed! |
|
@froystig made a good point in private conversation, that this might be symptomatic of jaxopt not using the cache properly and/or generating too many fresh functions instead of re-using the cache. I don't have the bandwidth to look into it right now, but leaving open in case someone can look into it more deeply |


I am trying to solve a problem where
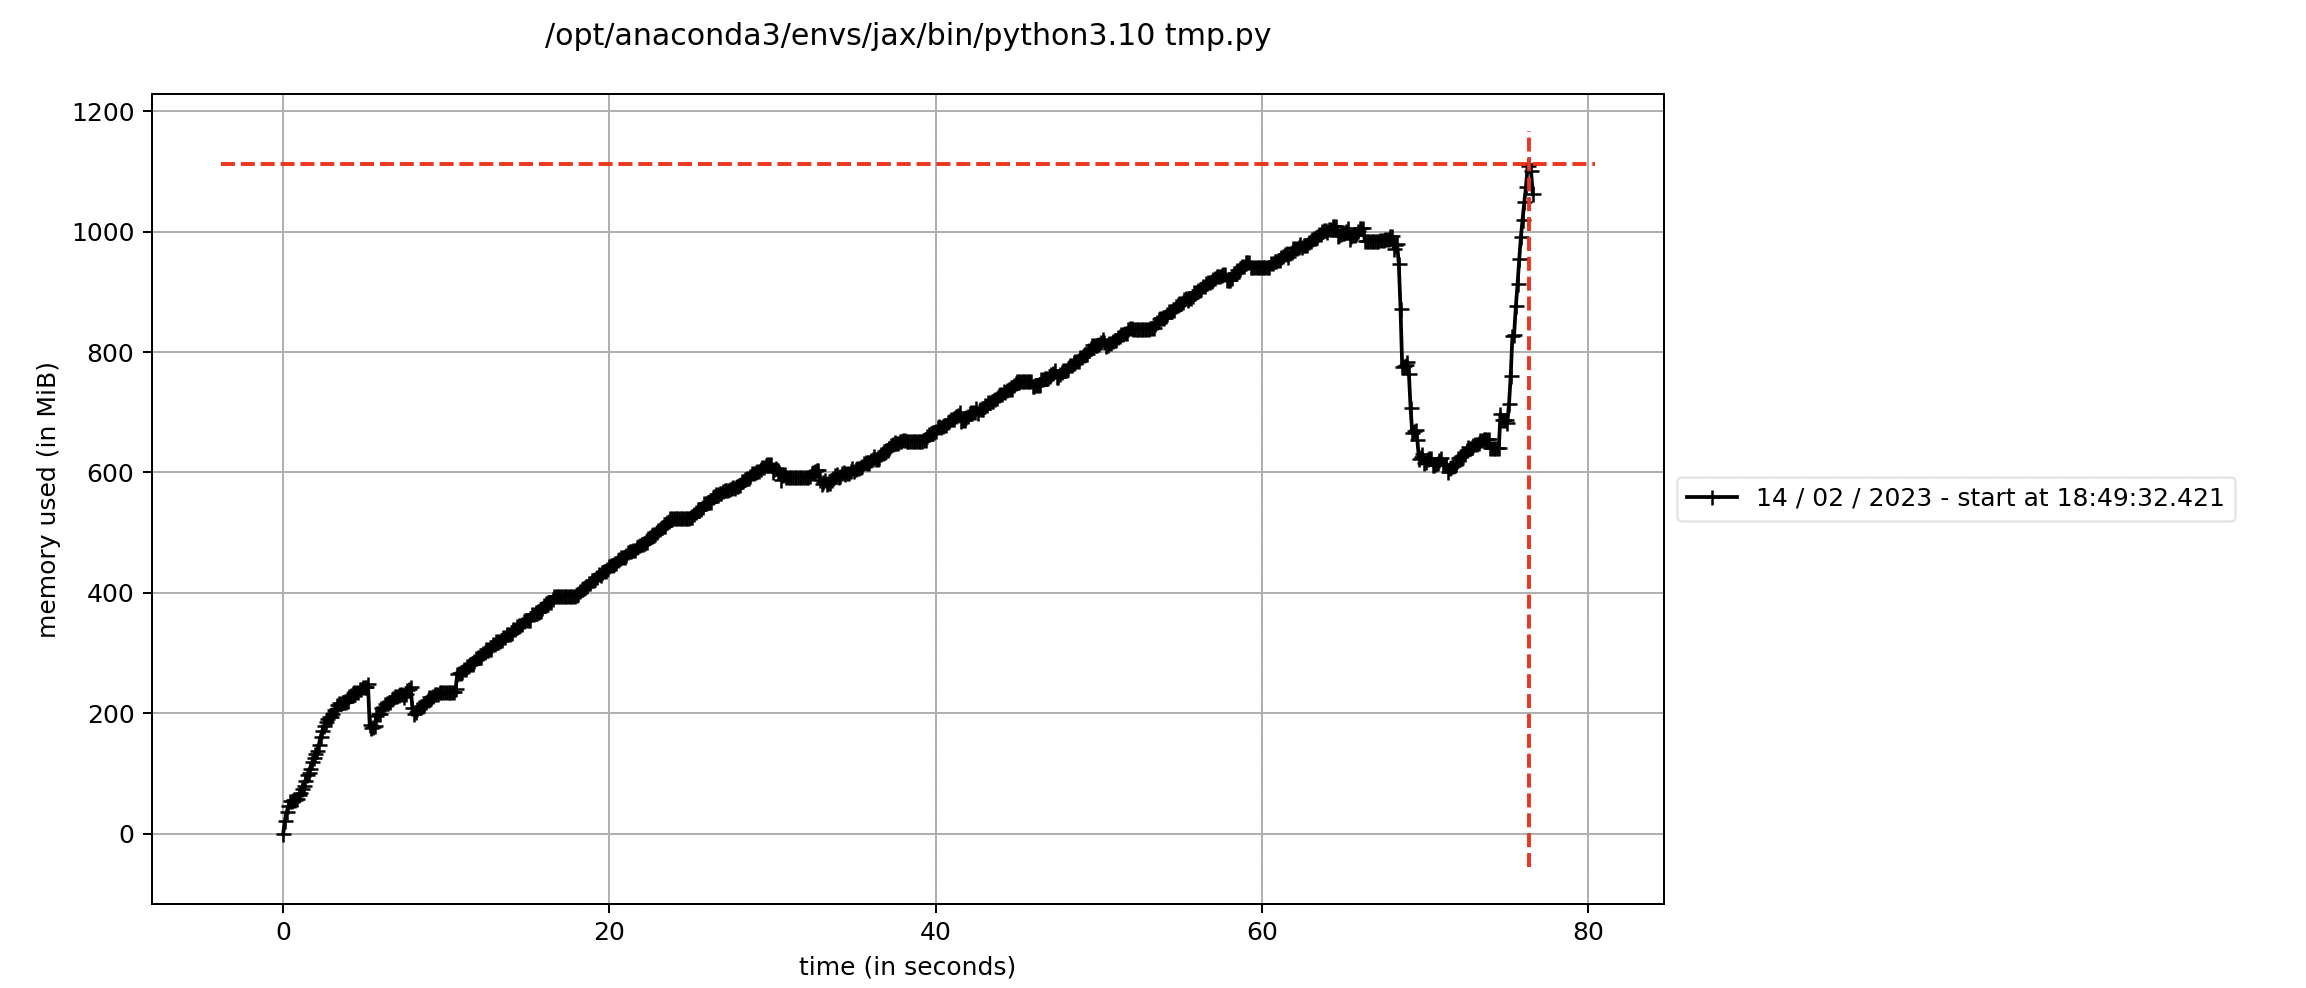
solver.runis called multiple times to minimize a series of functions while varying a parameter. Usingmemory_profilerI can see that the allocated memory increases each time the functionsolver.runis called and never decreases.Here is a minimal example to reproduce the issue:
And here is the corresponding plot of the allocated memory:

Can you please confirm the issue or provide a solution for that? Thanks. Alessandro
The text was updated successfully, but these errors were encountered: