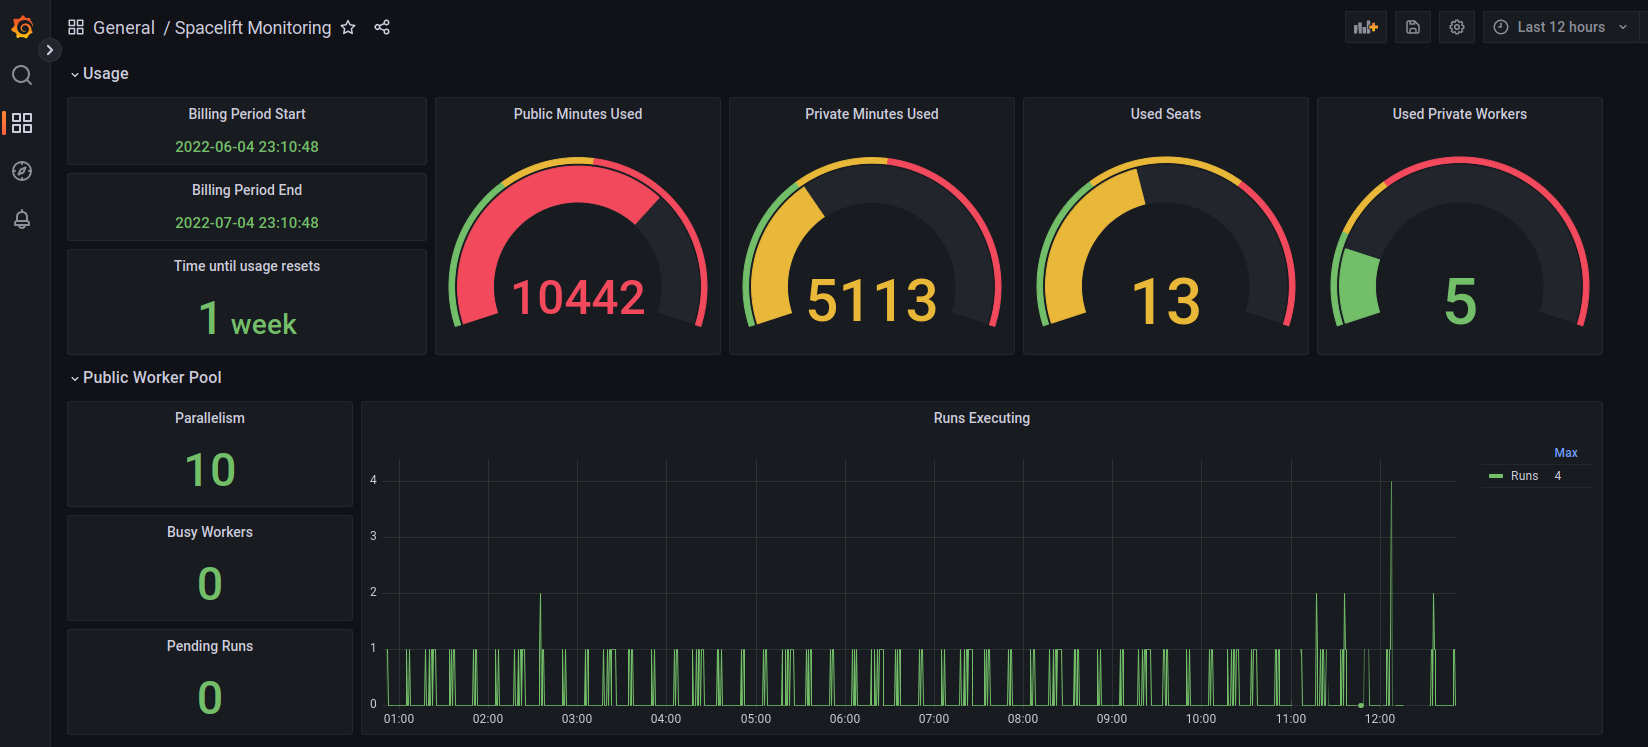
This repository contains a Prometheus exporter for exporting metrics from your Spacelift account.
The Spacelift exporter is provided as a statically linked Go binary and a Docker container. You can
find the latest release here.
The Docker container is available from our public container registry:
public.ecr.aws/spacelift/promex.
The exporter uses
Spacelift API keys
to authenticate, and also needs to know your Spacelift account API endpoint. Your API endpoint is in
the format https://<account>.app.spacelift.io, for example https://my-account.app.spacelift.io.
NOTE: the API key you use must be an Admin key because some of the API fields used for the metrics require administrative access.
Download the exporter binary from our
releases page, make sure it's
added to your PATH, and then use the spacelift-promex serve command to run the exporter binary:
spacelift-promex serve --api-endpoint "https://<account>.app.spacelift.io" --api-key-id "<API Key ID>" --api-key-secret "<API Key Secret>"Use the following command to run the exporter via Docker:
docker run -it --rm -p 9953:9953 -e "SPACELIFT_PROMEX_API_ENDPOINT=https://<account>.app.spacelift.io" \
  -e "SPACELIFT_PROMEX_API_KEY_ID=<API Key ID>" \
  -e "SPACELIFT_PROMEX_API_KEY_SECRET=<API Key Secret>" \
public.ecr.aws/spacelift/promexYou can use the following Deployment definition to run the exporter:
apiVersion: apps/v1
kind: Deployment
metadata:
  name: spacelift-promex
  labels:
    app: spacelift-promex
spec:
  replicas: 1
  selector:
    matchLabels:
      app: spacelift-promex
  template:
    metadata:
      labels:
        app: spacelift-promex
    spec:
      containers:
        - name: spacelift-promex
          image: public.ecr.aws/spacelift/promex:latest
          ports:
            - name: metrics
              containerPort: 9953
          readinessProbe:
            httpGet:
              path: /health
              port: metrics
            periodSeconds: 5
          env:
            - name: "SPACELIFT_PROMEX_API_ENDPOINT"
              value: "" # Add your endpoint here
            - name: "SPACELIFT_PROMEX_API_KEY_ID"
              value: "" # Add your API key here
            - name: "SPACELIFT_PROMEX_API_KEY_SECRET"
              value: "" # Add your secret here
            - name: "SPACELIFT_PROMEX_LISTEN_ADDRESS"
              value: ":9953"
To use the example deployment, make sure you fill in the API endpoint, API Key ID and API Key Secret, as explained in the comments. For a production deployment we would recommend making use of Kubernetes secrets rather than embedding the API key values directly.
By default the exporter listens on port 9953. To change this use the --listen-address flag or the
SPACELIFT_PROMEX_LISTEN_ADDRESS environment variable:
spacelift-promex serve --listen-address ":9999" --api-endpoint "https://<account>.app.spacelift.io" --api-key-id "<API Key ID>" --api-key-secret "<API Key Secret>"To get information about all the available commands and options, use the help command:
$ spacelift-promex help
NAME:
   spacelift-promex - Exports metrics from your Spacelift account to Prometheus

USAGE:
   spacelift-promex [global options] command [command options] [arguments...]

VERSION:
   0.0.1

COMMANDS:
   serve    Starts the Prometheus exporter
   help, h  Shows a list of commands or help for one command

GLOBAL OPTIONS:
   --help, -h     show help (default: false)
   --version, -v  print the version (default: false)


COPYRIGHT:
   Copyright (c) 2022 spacelift-io
To get information about an individual command, use the --help flag:
$ spacelift-promex serve --help
NAME:
   spacelift-promex serve - Starts the Prometheus exporter

USAGE:
   spacelift-promex serve [command options] [arguments...]

OPTIONS:
   --api-endpoint value, -e value    Your spacelift API endpoint (e.g. https://myaccount.app.spacelift.io) [$SPACELIFT_PROMEX_API_ENDPOINT]
   --api-key-id value, -k value      Your spacelift API key ID [$SPACELIFT_PROMEX_API_KEY_ID]
   --api-key-secret value, -s value  Your spacelift API key secret [$SPACELIFT_PROMEX_API_KEY_SECRET]
   --is-development, -d              Uses settings appropriate during local development (default: false) [$SPACELIFT_PROMEX_IS_DEVELOPMENT]
   --listen-address value, -l value  The address to listen on for HTTP requests (default: ":9953") [$SPACELIFT_PROMEX_LISTEN_ADDRESS]
--scrape-timeout value, -t value The maximum duration to wait for a response from the Spacelift API during scraping (default: 5s) [$SPACELIFT_PROMEX_SCRAPE_TIMEOUT]To get version information, use the --version flag:
$ spacelift-promex --version
spacelift-promex version 0.0.1The following metrics are provided by the exporter:
| Metric | Labels | Description |
|---|---|---|
spacelift_public_worker_pool_runs_pending |
The number of runs in your account currently queued and waiting for a public worker | |
spacelift_public_worker_pool_workers_busy |
The number of currently busy workers in the public worker pool for this account | |
spacelift_public_worker_pool_parallelism |
The maximum number of simultaneously executing runs on the public worker pool for this account | |
spacelift_worker_pool_runs_pending |
worker_pool_id, worker_pool_name |
The number of runs currently queued and waiting for a worker from a particular pool |
spacelift_worker_pool_workers_busy |
worker_pool_id, worker_pool_name |
The number of currently busy workers in a worker pool |
spacelift_worker_pool_workers |
worker_pool_id, worker_pool_name |
The number of workers in a worker pool |
spacelift_worker_pool_workers_drained |
worker_pool_id, worker_pool_name |
The number of workers in a worker pool that have been drained |
spacelift_current_billing_period_start_timestamp_seconds |
The timestamp of the start of the current billing period | |
spacelift_current_billing_period_end_timestamp_seconds |
The timestamp of the end of the current billing period | |
spacelift_current_billing_period_used_private_seconds |
The amount of private worker usage in the current billing period | |
spacelift_current_billing_period_used_public_seconds |
The amount of public worker usage in the current billing period | |
spacelift_current_billing_period_used_seats |
The number of seats used in the current billing period | |
spacelift_scrape_duration |
The duration in seconds of the request to the Spacelift API for metrics | |
spacelift_build_info |
Contains build information about the exporter (version, commit, etc) |
If you're looking for inspiration, you can find an example Grafana dashboard here.
