Canadian Fire Plume Detected During NAAMES Transit Flight

Island from the air
NASA’s C-130 descends down in a spiral over Sable Island during a May 13 transit flight. Credit: Denise Lineberry / NASA

by Denise Lineberry / ST. JOHN’S, CANADA /

Sometimes, researchers don’t find data as much as the data finds them. Such was the case for the transit flight on May 13 from NASA’s Langley Research Center to St. John’s International Airport to support NAAMES, or the North Atlantic Aerosols and Marine Ecosystems Study.

The mission focuses on collecting biogenic or marine aerosols — far away from land and away from human influence. After all, about 71 percent of Earth’s surface is water, and the oceans hold about 96 percent of it. It can be easy for the everyday person on land to overlook the massive influence that the ocean has on the atmosphere and climate. But by air and sea, NAAMES researchers work tirelessly in the field to study this connection.

Flying over narrow, crescent-shaped Sable Island in Nova Scotia, some 185 miles southeast of Halifax and home to only a handful of residents, is a great place to collect biogenic data and validate aerosol instruments from a ground site on the island.

NAAMES researchers flying over during the transit flight on NASA’s C-130 at 3,200 feet didn’t expect to fly through an extensive smoke plume. But that’s exactly what happened. 

Along the aircraft’s track, the plume appeared as a haze, but the scientific instruments on board the aircraft would get a much better view. The instruments, along with measurements from a ground station on Sable Island, measured the vertical extent and composition of the plume. To do this, they ascended and descended in spirals over the island to fully capture the plume’s variations.

Onboard, the LARGE, or Langley Aerosols Research Group Experiment, in situ suite captured aerosol features in the marine boundary layer and upper troposphere. Langley’s HSRL, or High Spectral Resolution Lidar, also captured data on smoke features in the marine boundary layer of the atmosphere, widely influenced by the ocean.

The High Spectral Resolution Lidar (HSRL) lidar captures smoke features in the atmosphere and ecosystem features in the ocean. Credit: NASA

The curiosity that makes a scientist, well, a scientist, kicked into full gear. They wanted to know where the plume came from.

They knew of wildfires, which began on May 3 just southwest of Fort McMurray and proceeded to sweep through the community, resulting in Alberta’s largest wildfire evacuation. But to see from where else the plume could have originated, they looked at a map from the Canadian Wildland Fire Information System.

From there, they were able to create a forward trajectory of fires using the National Oceanic and Atmospheric Administration’s Hybrid Single Particle Lagrangian Integrated Trajectory (HYSPLIT) Model, and determined that the plume over Sable Island came from fires near Winnipeg. Earlier this month, two massive forest fires broke out on the Manitoba-Ontario border covering about 75,000 hectares at its peak, resulting in the evacuation of two provinces. Since then, it’s been 60 percent contained. The plume from the fires traveled about 1,700 miles to Sable Island in Nova Scotia, where it was detected by NASA’s C-130.

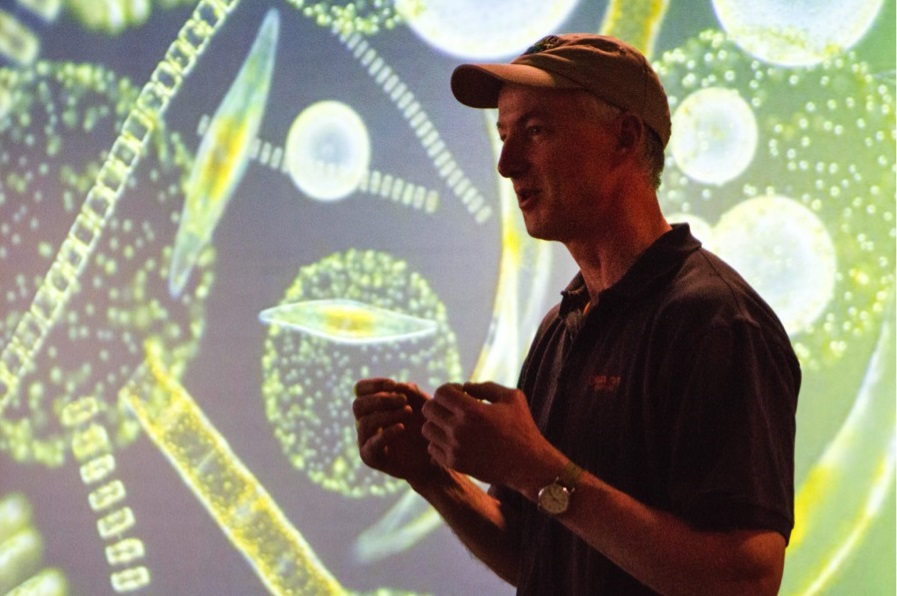
“It is well known that biomass plumes from large forest fires are transported a great distance across the globe,” said NAAMES research scientist John Hair. “It will be interesting on this flight to connect the aircraft measurements made in the atmosphere and the ocean, and relate them to what the satellite saw on the same day.”

The NAAMES team will further study the plume data gathered from the transit flight with help from student researchers making corroborative data from the Sable Island Ground Station, the only permanently staffed facility on the island.

Students.
Student researchers make corroborative measurements at a ground station on Sable Island for NAAMES. Credit: Mark Gibson

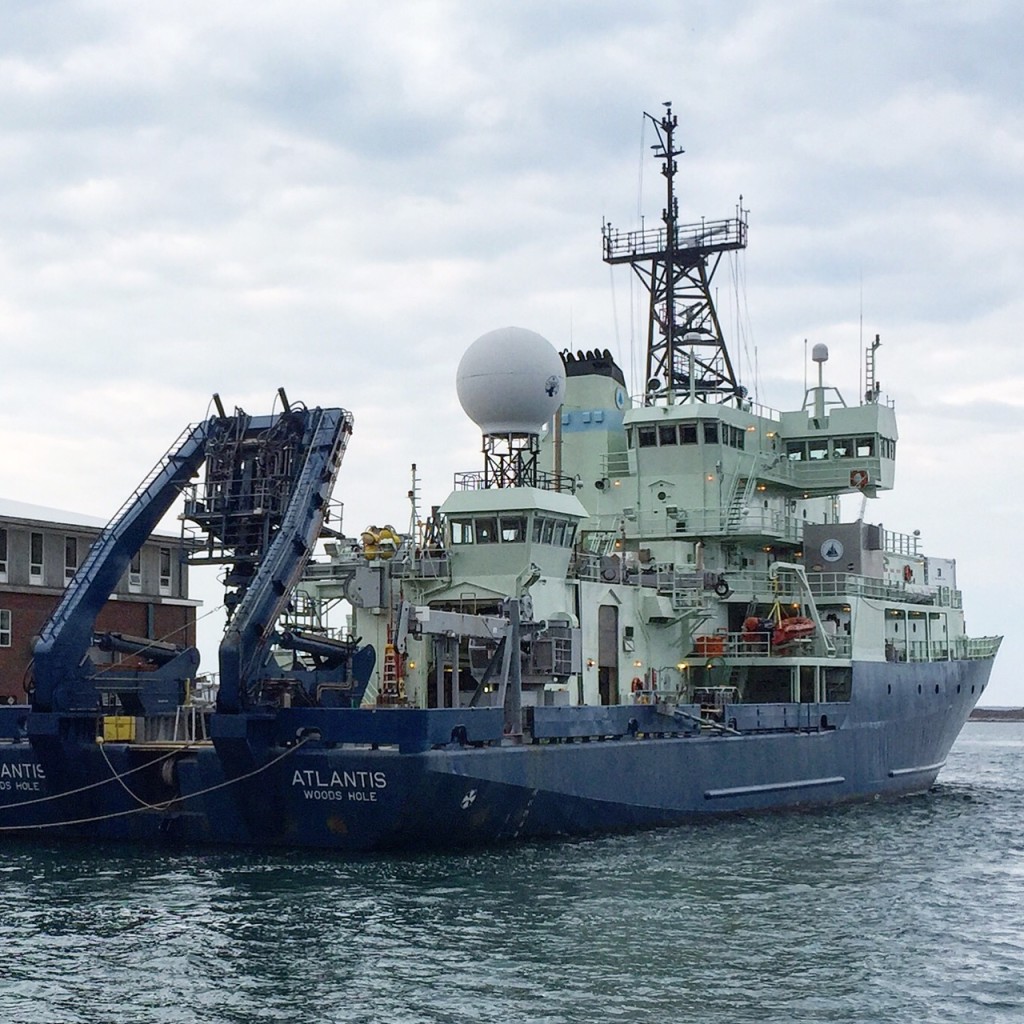
The team was pleased that the plume’s trajectory does not reach as far out as their NAAMES mission study area, approximately 500 nautical miles off the coast of the North Atlantic, where marine aerosols and the research vessel Atlantis roam free. That’s where they were headed for their first official science flight on May 18.

From plumes rising from massive fires to aerosols rising from microscopic marine life – everything on the land, in the ocean and in the atmosphere plays a part in Earth’s interconnected system. And some very curious NAAMES researchers are on the case to understand a massive part of that system better than they ever have before.

Sunny with a Chance of Icebergs

While in the field, plans can change as quickly as the weather. Meteorologists for the North Atlantic Aerosols and Marine Ecosystems Study (NAAMES) constantly provide forecasts for the aircraft and ship teams who, weather permitting, will rendezvous several times over the next few weeks in the North Atlantic — home to the world’s largest phytoplankton bloom. Plankton ecosystems profoundly affect climate and life on Earth.

NAAMES meteorologists Amy Jo Scarino and Michael Shook tend to work behind the scenes, but they are an integral part of making the mission successful. Amy Jo, a Penn State graduate with a B.S. in meteorology, works at NASA’s Langley Research Center. Michael graduated from the University of Kansas with a B.S. in atmospheric science and began working at NASA Langley as a programmer/analyst with the atmospheric composition branch.

Amy Jo Scarino. Credit: Michael Starobin/NASA

Amy, what is your involvement with the NAAMES mission?

AJS: I am one of the project meteorologists and helping out with flight planning.  I am also a member of the High Spectral Resolution Lidar [HSRL] team – one of the instruments on the C-130 – and will assist with processing the data.

How did you end up in meteorology?

AJS: Growing up in Michigan, I always enjoyed the weather, especially watching thunderstorms from the front porch and also lake effect snowstorms.  In high school, I made contact with the local meteorologist in Grand Rapids, Michigan–George Lessens.  He became my mentor, and I learned the ropes of forecasting during an internship at WZZM-13.  George went to Penn State for meteorology, so that is where I decided I wanted to also go for college.  At Penn State I participated in the Campus Weather Service, providing forecasts for The Daily Collegian and select Pennsylvania radio stations.

What is a typical day like to forecast for NAAMES?

AJS: Every day Michael Shook or I prepare the forecast by looking at current observations and then start looking at the latest model runs.  For NAAMES, one of the main drivers is forecasting clouds and the synoptic pattern, but also forecasting sea state [ocean wind and waves] for the R/V Atlantis. We then have a daily forecast briefing with recommendations on the outlook for potential science flight days. On the day of a planned science flight, I am up a couple hours before the C-130 would take off for the go/no-go meeting.  At that time, we are checking current observations and confirming whether the previous day’s forecast still stands or not.  Take a breath and repeat; during a field campaign, the meteorologists don’t take a day off.

How does your work on NAAMES compare to other projects you’ve worked on?

AJS: Other projects I have worked on have been related to applications of the HSRL data from other field campaigns, such as deriving mixed layer heights from aerosol backscatter profiles and relating that to air quality studies. For the first NAAMES mission, I provided the weather forecasts from home base at NASA Langley.  This time I am out in the field and working right with the project scientists, flight planners and the instrument scientists.

Being out in the field, are you going to do anything exciting in St. John’s?

AJS: Gearing up for the second NAAMES mission, I was watching the iceberg field that is in the North Atlantic Ocean off the coast of Newfoundland and Labrador.  I am hoping that while I am in the field I can view an iceberg from Signal Hill or other areas along the coast.

Michael Shook. Credit: Michael Starobin/NASA

Michael, how did you end up in meteorology?

MS: I’ve always loved the weather for as long as I can remember.  Growing up, I wanted to be an operational forecaster for the National Weather Service.  To work toward that goal, I got my bachelor’s degree in atmospheric science from the University of Kansas.  Through my courses and after graduation, I learned that atmospheric science includes much more than operational forecasting, which is how I ended up as a contractor for NASA working with the Langley Aerosol Research Group and the airborne science data management team.  With my meteorology background, NAAMES asked if I could help them with flight forecasting as well.

What does a typical day in NAAMES look like for the forecasters?

MS: On a day that we don’t have a flight scheduled, we come in around 7:30am to work with the flight planners and project scientist to adjust our plans to account for changes in the weather forecast.  That way, changes in the flight plans can be communicated with air traffic control as soon as possible.  Then we begin reviewing observations and atmospheric and ocean model forecasts to prepare for a 2 pm briefing to the science team, looking for the right conditions to fly over the coming week.  On flight days, we come in as early as 4am to help make the final go/no-go call before a flight, and then help support the scientists in the air by feeding them updated weather information from the ground.

What other work do you do on NAAMES?

MS: In addition to forecasting, I also process data from some of the Langley Aerosol Research Group instruments and create standardized data files that get uploaded to the NAAMES data archive.  In addition, I create combined files—we call them “the merge”—from all the individual instrument groups’ files and the aircraft’s position information.  In a lot of cases, looking at data from a single instrument isn’t as helpful as getting a comprehensive look from all the instruments, so these files are invaluable as the scientists start analyzing the data we’ve collected.

What are you going to do in St. John’s when you’re not working on NAAMES?

MS: If we get some down time, I want to visit Cape Spear, which is the easternmost point in North America.  I’d also love to see an iceberg and try curling for the first time.

How does your work on NAAMES compare to the other projects you’ve worked on?

MS: I’ve traveled to a few field campaigns before to do data processing and merging, but this is the first time I’ve traveled to do forecasting.  On the first deployment of NAAMES, the forecasting team stayed in Virginia, which made it difficult to coordinate schedules and ask and answer the quick little questions that invariably come up.  This is also my first time supporting a field campaign in a different country!

Flying Scientific Detours Is All Part of the Plan

The NAAMES team prepares for the transit flight to St. John’s International Airport, where it will reside between science flights in which the C-130 rendezvous with the R/V Atlantis in the North Atlantic. Credit: NASA/Denise Lineberry
The NAAMES team prepares for the transit flight to St. John’s International Airport, where it will reside between science flights in which the C-130 will rendezvous with the R/V Atlantis in the North Atlantic. Credit: NASA/Denise Lineberry

by Denise Lineberry / ST. JOHN’S, CANADA /

On Friday, May 13, Shane Tungate, the aircraft loadmaster, provides a safety briefing to some of the NAAMES, or North Atlantic Aerosols and Marine Ecosystems Study, team members at NASA’s Langley Research Center, who are preparing to board the C-130 for St. John’s International Airport, Newfoundland. Before the team even gets the chance to get seated, someone hollers out, “Power down!”

An invertor replacement is needed for the engine. At NASA’s Wallops Flight Facility, located on Virginia’s Eastern Shore, someone hops in a golf cart to hunt down a replacement from a non-flyable “parts plane.”  The part is found and the B-200 flies it some 75 miles from Wallops to Langley. The part is replaced, and the C-130 flight is three hours behind scheduled takeoff, but preparing for flight.

NAAMES is in the field this month on the second of four deployments. About half the carbon dioxide emitted into Earth’s atmosphere each year ends up in the ocean, and plankton absorbs a lot of it. NAAMES studies the world’s largest plankton bloom and how it gives rise to small organic particles that leave the ocean and end up in the atmosphere, ultimately influencing clouds and climate. This month coincides with a critical phase of the bloom. Researchers will take measurements by sea and by air from St. John’s.

Not much is conventional about a ride on NASA’s C-130. The seat belt buckle looks a little like it’s from medieval times. Some walls are covered in diamond-stitched liner and many stretches and bundles of cords line the sides and top of the aircraft’s interior. Window seats are not an option since the only windows are on the aircraft’s three doors and in the cockpit.

Seat belt
The seatbelt buckle on the C-130H. It doesn’t have to be pretty; it just has to work. Credit: NASA/Denise Lineberry

When in flight, the cockpit’s room temperature is about 70 degrees F. The middle of the plane, where a majority of the team is seated, is about 60 degrees F. The back of the plane, occupied by items such as water and luggage, is about 30 degrees F.

The takeoff is smooth and the team’s screens immediately begin to light up with colorful data plots from instruments on board the C-130, such as the GCAS (GeoCAPE Airborne Simulator) and AMS (Aerosol Mass Spectrometer).

It is a nonstop transit flight with the end goal of getting the team to St. John’s to start planning science flights in coordination with the R/V Atlantis. However, the scientists are so anxious to get data that they set up some scientific detours along the way.

Remote sensing instruments on board the C-130 gather color gradient measurements, from the clear water in the Albemarle Sound to the most productive ocean water in the world in the North Atlantic.

“You can see a distinct change in ocean,” one team member says over the aircraft’s communication system as we pass from one gradient to another.

The C-130 also spirals down over Sable Island, just southwest of Newfoundland.  From the cockpit, the surface water goes from flat to angled, flat to angled, as the pilots circle the aircraft lower. The island comes in and out of sight, along with the sun and a pod of seals hopping in and out of the water. It’s such a beautiful view and a surprisingly pleasant circling descent that it’s almost easy to forget this maneuver has a scientific purpose — Sable Island is home to a ground observation site that double-checks the accuracy of aerosol measurements being made on the C-130.

“This looks like an ideal spot,” says NASA Langley scientist Ewan Crosbie over the C-130 telecom.

“Roger that,” says NAAMES Deputy Project Scientist Rich Moore.

“Beginning descent,” the pilot communicates.

They are descending into a “box,” or identified and secured airspace, that was specifically mapped out to test a new instrument that samples cloud water from low-level, warm clouds.

From the ground site on Sable Island, the C-130 can be seen passing over in the upper distance. Credit: NASA/Codey Barnett
From the ground site on Sable Island, the C-130 can be seen passing over in the distance. Credit: NASA/Codey Barnett

The grand finale of the transit flight includes an overpass of the R/V Atlantis in the North Atlantic. The comparison and combination of the shipborne and airborne measurements are the bread and butter of the NAAMES mission. And this initial flight over the Atlantis marks the first of several that will take place over the next few weeks to better understand the ocean-atmosphere interaction.

In the moments before landing, Moore calls out to the instrument teams for checks before powering down the aircraft. All instruments gathered data and the team is delighted to have such clear conditions to measure — thanks to the NAAMES meteorologists who forecasted that leaving a day earlier than planned would be best for the instrument teams.

Weekend plans in St. John’s for NAAMES involve aircraft and instrument maintenance, weather forecasting and flight planning for the first official science flight, tentatively scheduled for Tuesday, May 17.

Atlantis Heads Out to the Bloomin’ Ocean

by Stephanie Schollaert Uz / Woods Hole, MA /

The whole is greater than the sum of its parts. To truly understand the whole, however, we need to analyze its parts. That is the mission of the ambitious North Atlantic Aerosols and Marine Ecosystems Study (NAAMES), whose scientists left port Wednesday with the outgoing tide on the research vessel Atlantis.

R/V Atlantis steaming away from Woods Hole on Wednesday, headed to the North Atlantic. Credit: Michael Starobin/NASA

During this second of four cruises, the ship is in a rush against time and mother nature to reach its northernmost station before the cyclical, massive spring bloom of phytoplankton spreads across the North Atlantic. This is a time when phytoplankton, microscopic algae at the base of the marine food web, grow faster than other things can eat them. The bloom occurs as sunlight increases and nutrients are plentiful at the water’s wind-mixed surface layer. Once their predators catch up, the phytoplankton decline.

The North Atlantic bloom normally peaks in May. Toby Westberry, of Oregon State University, has been watching satellite imagery carefully for the past few weeks and is worried that the bloom is early and already progressing northward. Westberry and NAAMES principal investigator Mike Behrenfeld, also of Oregon State, worked with the ship’s captain and chief engineer to put additional engines on the Atlantis. They hope to cut the week-long transit time to their first station by a few days so that they don’t miss this short window in the phytoplankton’s annual cycle.

Green seas in this satellite image -- captured by the MODIS instrument on NASA’s Aqua satellite on Wednesday (May 11, 2016) -- indicate that phytoplankton are starting to bloom in the North Atlantic north of 50 degrees North. The small globe in the lower right corner shows the scale of this image as the darker blue box. The approximate track of the Atlantis is sketched as a dashed red line. Credit: Norman Kuring/NASA
Green seas in this satellite image — captured by the MODIS instrument on NASA’s Aqua satellite on Wednesday (May 11, 2016) — indicate that phytoplankton are starting to bloom in the North Atlantic north of 50 degrees North. The small globe in the lower right corner shows the scale of this image as the darker blue box. The approximate track of the Atlantis is sketched as a dashed red line. Credit: Norman Kuring/NASA

NAAMES’ interdisciplinary, multi-institutional science team will take a comprehensive suite of measurements of biological and physical properties in the ocean and also measure the atmosphere for particles and trace gases associated with the spring bloom. This floating laboratory has more sophisticated science equipment per square foot than I have ever seen before. Not to mention an abundance of talented minds to collect and analyze the data through multiple methods from many perspectives.

One of the key goals of the mission is to observe the structure of the phytoplankton community in these ocean blooms to better understand the role of sunlight, predation, and disease by viruses and bacteria. There is a lot of diversity among microscopic phytoplankton and – believe it or not – there is a chance we may be able to distinguish kinds of phytoplankton (their different taxonomic levels) from satellites one day. Data collected by this cruise will assist with that effort.

Cleo Davie-Martin measures volatile organic compounds (gases) the phytoplankton release. Credit: Stephanie Schollaert Uz/NASA
Cleo Davie-Martin, Oregon State University, measures volatile organic compounds (gases) that phytoplankton release. Credit: Stephanie Schollaert Uz/NASA

The other key goal is to determine how plankton interact with the air by releasing small particles and trace gases that can lead to cloud formation. The role of airborne particles in trapping or reflecting sunlight and through cloud formation is one of the biggest open questions in understanding Earth’s climate.

The interdisciplinary ocean and atmospheric science questions of NAAMES parallel those of the upcoming Plankton, Aerosols, Clouds and ocean Ecosystems (PACE) satellite mission to study Earth as a system using an airborne hyperspectral ocean color instrument and polarimeter. Ship-based and airborne measurements will provide valuable information for scientists to develop and test analytical tools to use with future satellite data from PACE.

Jason Graff (left) measures the carbon in phytoplankton through an instrument that bombards sea-water samples with laser and sorts out phytoplankton by their optical response. Cleo Davie-Martin (right) measures volatile organic compounds (gases) the phytoplankton release. Both scientists are from Oregon State University. Credit: Stephanie Schollaert Uz/NASA
Jason Graff, Oregon State University, measures the carbon in phytoplankton through an instrument that bombards sea-water samples with laser and sorts out phytoplankton by their optical response. Credit: Stephanie Schollaert Uz/NASA

And that will bring the project full-circle. The NAAMES field campaign was conceived through analysis of the first continuous ocean color satellite record that Behrenfeld published in 2010. In that study, he noticed the annual phytoplankton spring bloom seemed to start much earlier than previously assumed. Subsequent field campaigns and modeling studies confirmed the basic idea but led to more questions. NAAMES hopes to answer these through its four field campaigns during different phases of the annual life cycle of phytoplankton. Better understanding these important Earth processes will lead to better modeling, that will enable us to more accurately predict and prepare for the future.

Because going to sea is such a precious opportunity, this cruise is packed to the gills with sophisticated sensors and scientists who will study the spring bloom from multiple angles. For the next three weeks, the R/V Atlantis will measure the living ocean along with a C-130 airplane that will fly over the ship collecting measurements of the sea and sky.

When asked about their favorite aspect of going to sea, the food and the camaraderie of shipmates are at the top of most scientists’ lists. Craig Carlson of the University of California at Santa Barbara said, “You’re living in the midst of focused science 24/7. The internet is slow and there are minimal distractions.”

Liz Harvey of the University of Georgia at Skidaway added, “With 16-20 hour days, getting enough sleep is a challenge.”

“Sleep is precious and you build your day around food,” said Graff in agreement. “You’re living on coffee, great food and adrenaline.”

If you’ve spent much time near the ocean, you understand how it can pull you in. And if you haven’t, well, you should.

Life ring and beacon on the R/V Atlantis in case someone falls overboard. Credit: Michael Starobin/NASA


Getting Social on Deck with NAAMES

by Stephanie Schollaert Uz / WOODS HOLE, MASS. /

Humans are social creatures. So what better way to connect them to the complex mission of an air and sea campaign to the North Atlantic that studies plankton, aerosols and cloud formation than through a NASA Social event?

On May 10, a dedicated group of 20 bloggers and social media users from around the country travelled to the sea-side village of Woods Hole, Massachusetts – home of the Woods Hole Oceanographic Institution (WHOI) – to hear about the multi-faceted North Atlantic Aerosol and Marine Ecosystems Study (NAAMES) from many of the people involved in its science and to tour the research vessel Atlantis.

NAAMESSocial2_Behrenfeld (1)

NAAMES Chief Scientist Mike Behrenfeld explains the importance of plankton for life on Earth. Credit: NASA/Michael Starobin

Michael Phillips, a meteorologist who travelled from New Jersey, is part of the Weather Boy team that uses Twitter, Facebook, Snapchat and Pinterest. His team of 15 originally used social media to connect with their TV and radio listeners, but now find that more and more of their half-a-million followers only connect to them through on-line content. Phillips covered the NASA Social because “Earth science and weather content resonates most with our audience.”

NAAMES_Social1_tweeting

NASA Social attendees were busy reporting to their followers during the NAAMES overview and question and answer session. Credit: NASA/Michael Starobin

Not all attendees hold day jobs related to Earth science or weather. A pastor from a Baptist church, a legal secretary, medical professionals, photographers and outdoor enthusiasts were among the group. The common theme that bound them was an appreciation for Earth science and innovative technology to make new discoveries. And a sense of adventure. Who else would take time off of work to travel to a previously unheard-of Cape Cod village during the off-season, some with family in tow, for an event like this?

NAAMESSocial3_listeningRapt attention during the NAAMES overview by NASA Social attendees who travelled from all over the country to attend the event. Credit: NASA/Michael Starobin

Attendees enthusiastically tweeted, posted and live-streamed through Periscope and Facebook throughout the day, especially while on the Atlantis. Phillips brought along a cut-out of their Weather Boy cartoon character and tweeted pictures of him around the ship to help audiences connect to the event.

The group toured spaces and equipment used during NAAMES, plus the bridge and living spaces — including the all-important galley. Several scientists emphasized how they build their days at sea around great food and meal times.

NAAMESSocial4_ship

Oceanographer Peter Gaube describes the conductivity, temperature, depth (CTD) sensor used to measure sea water density surfaces ‘like a layer cake’ from the ocean surface down to 1000m deep. Credit: NASA/Stephanie Schollaert Uz

The Social began with an overview of NASA’s Earth science program and the five-year field campaign in the North Atlantic by program manager Paula Bontempi of NASA’s Ocean Biology and Biogeochemistry program.

Rich Moore, NAAMES Deputy Project Scientist, described the campaign from the perspective of the C-130 aircraft overflights and the measurements they take of particles in the atmosphere that can form clouds. “Without particles in the atmosphere there would be no clouds,” he said.

Journalist Nicole Estephan participated in the first NAAMES cruise last fall and reported how much she cherished her time at sea despite its rough weather. She told the NASA Social participants that storms and high seas made it hard to do simple things like walking and showering. “Every time a wave hits the side of the ship it’s like a cannonball hitting your head, she said.

NAAMES chief scientist Mike Behrenfeld of Oregon State University emphasized that phytoplankton blooms are very important for sustaining marine fisheries and our climate. When asked if humans are impacting them and, if so, what we can do, WHOI scientist Scott Doney described his modeling work to tease apart natural climate patterns from those caused by humans. The biggest impact humans are having is the emission of carbon dioxide into the atmosphere. Ultimately, the choice to reduce our carbon emissions is our responsibility. After all, humans are social — with the capacity to make new discoveries and solve problems together.


Setting a Course for the World’s Largest Plankton Bloom

The research vessel Atlantis in port. Credit: Michael Starobin/NASA

by Stephanie Schollaert Uz / Woods Hole, MA /

Stephanie Schollaert Uz, PhD, is an ocean scientist working in the Ocean Ecology Lab at NASA Goddard Space Flight Center in Greenbelt, Maryland. Her research interests include the response of ocean biology to physics. She also coordinates communications for the future NASA ocean color satellite PACE, which will be designed to monitor plankton, ocean ecosystems, airborne particles and clouds.

Timing is everything in life. As the second North Atlantic Aerosols and Marine Ecosystems Study (NAAMES) cruise prepares to get underway tomorrow, a tightly choreographed and synchronized mobilization plan has been in full swing on the research vessel Atlantis.

From ship crew to the science party and the extra helpers in port, everyone is getting the ship ready for its mission to chase and measure the springtime peak in the North Atlantic phytoplankton bloom and the airborne particles they can release to the atmosphere under the right conditions. Their findings will help scientists better understand how these processes influence clouds and climate.

One week ago, Atlantis returned to its home port in Woods Hole, Massachusetts from its previous mission of searching for the merchant ship El Faro that sank last fall. The ship’s crew and scientists have a total of nine days to turn Atlantis from a ship seeking a single black box in the deep ocean to one seeking billions of plankton in the sun-lit surface ocean and airborne particles in the atmosphere.

The research vessel Atlantis in port during the off-load of the submersible Alvin as the ship prepares for its second NAAMES field campaign. Credit: Dick Pittenger/WHOI

NAAMES Chief Scientist Michael Behrenfeld of Oregon State University compares the transformation with a puzzle: first, the equipment from the last cruise was removed. The deep-diving submersible Alvin needed to be carefully lifted off using a commercial crane.

Next, the ship was loaded with NAAMES equipment, starting with the biggest gear. Cranes moved four shipping containers, which were outfitted as lab space to measure aerosols, onto the ship’s deck, followed by boxes of sophisticated optical instruments, incubators and other equipment needed for detecting phytoplankton, zooplankton, bacteria and viruses as they cycle through life and death. Several instruments also measure chemistry related to biological processes in the ocean.

According to Ken Kostel with Woods Hole Oceanographic Institution (WHOI) Communications, this cruise requires more equipment than he’s seen on a typical cruise. Many of the science instruments are unusual, such as snorkels on the ship’s forward half that will continuously intake air to be analyzed for its aerosol content. There are also seawater flow-through systems to analyze ocean biology during the peak of the spring bloom and its subsequent decay. Several instruments will be deployed over the side of the ship. Some will profile the ocean down through the mixed layer, and even deeper, as is the case for the Argo floats.

Françoise Morison (left) of the University of Rhode Island and Caitlin Russell, a former intern at the University of Rhode Island, secure incubators to be used for measuring phytoplankton growth rate under various light levels and their consumption by single-celled organisms and viruses. Credit: Stephanie Schollaert Uz/NASA

Behrenfeld has been studying rare cloud-free satellite images of the North Atlantic, the last clear view being in mid-April, and noticed an earlier spring bloom than usual this year starting in the subtropical North Atlantic. Because the spring bloom progresses northward, he hopes to catch the end of the bloom peak in the north and monitor its decline as the ship transits southward – very valuable scientific information that has never before been measured in all its complexity.

The main lab on Atlantis where the science party will conduct many analyses while underway, along with measurements taken in several other labs and vans. Credit: Michael Starobin/NASA
While underway, the science party will conduct many analyses in Atlantis’s main lab. Credit: Michael Starobin/NASA

In addition to the science party, the ship’s crew is busy preparing. The captain, Al Lunt, piloted the NAAMES cruise last fall. It will take Atlantis about a week to get to their northernmost station: southeast of Greenland, around 60 degrees north and 40 degrees west. From there, they will steam directly south through six stations, the last being around 40 degrees north and 40 degrees west.

Meanwhile, the ship’s navigator and second mate, Logan Johnsen, is calculating the best transit route using weather and ocean maps from the National Oceanic and Atmospheric Administration’s Ocean Prediction Center. Also included are maps of glaciers that the ship would rather avoid. (The Titanic had unlucky timing in that regard and lacked the benefit of modern technology.)

Logan Johnsen, Atlantis navigator and second mate, studies weather and ocean forecast products to plan the best course to the ship’s North Atlantic study site. Credit: Stephanie Schollaert Uz/NASA

At 275 feet long, Atlantis is one of the biggest and most expensive ships in the US Academic Research Fleet, owned by the US Navy and operated by WHOI. A day at sea costs approximately $50,000. Its funding comes from a number of federal agencies like the National Science Foundation (NSF), NASA and the Office of Naval Research. According to Rose Dufour of NSF, between 75 and 95 percent of its cost is covered by NSF in a typical year.

Aligning a cruise to a location of interest can take several years of planning, preparation and waiting your turn. In the end, whether this well-equipped NASA-funded NAAMES campaign catches the North Atlantic spring bloom will depend on its timing.

A Visit to Taehwa Research Forest

Forest from above

by Emily Schaller / OSAN AIR BASE, SOUTH KOREA /

Driving up a winding, bumpy road through a peaceful forest with tall pine trees towering over us, it was easy to forget that the megacity of Seoul was only 25 miles away.

This serene spot is the location of theTaehwa Mountain Forest Research site, one of the ground-monitoring “super sites” for the Korea US Air Quality (KORUS-AQ) study.    

South Korea maintains a network of more than 300 air quality research stations across the peninsula. KORUS-AQ is making use of data from these ground sites and has added significantly to the instrumentation at two locations (Olympic Park and Taehwa Mountain) and dubbed them ground “super sites.”

The Taehwa site hosts a suite of air quality monitoring instruments from the Korean National Institute for Environmental Research (NIER), NASA, the University of California Irvine, Korea University, the U.S. Environmental Protection Agency and Aerodyne Systems.

One of the key issues for improving air quality forecasts is better understanding how human emissions from cars, power plants and industry interact with natural emissions from trees and plants.  Although we usually think of forest air as being completely clean, chemical emissions from trees — called volatile organic compounds (VOCs) — are not always benign, especially when these emissions mix and react with urban emissions.  These reactions can form ozone, a gas that is harmful to both human and plant health, as well as secondary organic aerosol particles. Understanding the complex chemistry taking place on the boundaries between urban and rural areas is important for better predicting and developing strategies for improving local and global air quality.

The Taehwa site, located in a mountainous forest, is the perfect location for addressing questions about how human-caused and natural emissions mix.  The site boasts a 130-foot tower that reaches well above the tree line.  Climbing the steps up the tower affords great views of the forest below and allowed us to see up close the air inlets and instrumentation placed at regular intervals along the tower.

Forest tower
The tower at the Taehwa Mountain Forest Research site. Credit: NASA/Jane Peterson

At the base of the Taehwa tower are several structures filled with a variety of instruments that analyze the air collected at different heights along the tower as well as air collected by inlets at ground level.  These instruments measure different VOCs as well as many other molecules and compounds important for unraveling the complex chemistry occurring at the site. In addition, instruments below the tower also analyze in detail small particles in the atmosphere, counting them and measuring their sizes.  

Research building
Though the outside of this building and its setting look primitive, inside are a suite of sophisticated air quality monitoring instruments. Credit: NASA

In yesterday’s blog, I discussed how the DC-8 flies in spiral patterns to sample the air from near the ground up to 25,000 feet near Taehwa. By flying our KORUS-AQ aircraft near this site, we extend the reach of the air quality measurements from the top of the tower to nearly five miles up in the troposphere.

Aircraft in flight.
NASA’s DC-8 (top center) as seen from the Taehwa Mountain Forest Research tower on May 2 during the first KORUS-AQ science flight. Credit: Saewung Kim, UC Irvine

In addition to air quality and meteorological instruments at the tower, down the hill scientists from NASA Goddard Space Flight Center are measuring ozone above the site with the Goddard Ground-Based Tropospheric Ozone Lidar and with daily launches of balloons carrying instrumentation to measure ozone up into the stratosphere.  The ground-based ozone instrument uses an infrared laser that shines from the top of a trailer up through the lower atmosphere and allows scientists to measure ozone concentrations up to several miles above the ground.  This instrument is similar to the NASA Langley Airborne Differential Absorption Lidar (DIAL) being flown during KORUS-AQ on the DC-8.

Once a day the Goddard team launches a balloon outfitted with instrumentation to measure ozone along with temperature, pressure and humidity.  These ozonesondes collect and transmit the concentration of ozone from the surface all the way up to about 19 miles, when the balloon pops and the ozonesonde falls back to Earth on a small parachute. The team launches an ozonesonde daily and will launch one during every KORUS-AQ flight to provide complementary data of ozone in the atmosphere below and above the altitudes of the planes.

Science instrument rises into the air.
The team from NASA Goddard Space Flight Center launches an ozonesonde into the atmosphere. Behind them is the trailer housing the Goddard Ground-Based Tropospheric Ozone Lidar. Credit: NASA/Steve Cole

After visiting the Taehwa ground site, meeting the students and researchers working there, learning about their instruments, watching an ozonesonde launch into the stratosphere, and climbing up the research tower (which forced me to overcome a slight fear of heights), I was struck by the diversity of people, instruments and platforms (aircraft, ground, balloons, satellites) that have been brought together to try to solve the problem of poor air quality.

A “Clean” Start for First KORUS-AQ Flights

by Emily Schaller / Osan Air Base, Seoul, South Korea /

After years of preparation, on Monday, May 2, the three KORUS-AQ aircraft (NASA B-200, NASA DC-8, and the Hanseo King-Air) took off for their first coordinated science flights over South Korea. More than 50 scientists, pilots and crew from NASA and the Republic of Korea were aboard the three aircraft and flew thousands of miles across the Korean peninsula over the course of eight hours.

Satellite image
Satellite image showing the positions and flight tracks of the three aircraft over the Korean peninsula at 11:30AM Korean Standard Time during the first KORUS-AQ science flights.

The tracks the planes flew were not simple point-A-to-point-B flights. Instead, the scientists designed flight plans that allowed them to sample pollution at many locations, altitudes and times of day. Before every flight, a team of meteorologists and air quality forecasters pour over data from satellites and model outputs to predict the sources, amounts and types of pollution the team may encounter and suggest appropriate flight paths so that the aircraft can best sample this pollution.

The meteorological and pollution conditions on Monday were such that the Korean peninsula was experiencing fairly good air quality. Why bother to fly if our goal is to sample high levels of pollution? This flight provided the team with a great opportunity to set a clean baseline. The relatively clean-air data collected on Monday will be compared to data collected on future pollution-filled flights, allowing the team to understand the full range of conditions on the peninsula.

Using aircraft to study pollution allows scientists to sample the air at multiple altitudes, from near ground level all the way up to about 25,000 feet. One way to do this is by flying ascending and descending spiral patterns as well as flying straight and level legs at several altitudes. We also sample at different times of the day to look at how the chemistry evolves as the day progresses and sunlight drives chemical reactions.

Below is a time-lapse video showing the flight paths of our three aircraft from 8AM- 4PM Korean Standard Time on Monday, May 2:


The DC-8 flight plan on Monday included spiral patterns from about 1000 feet all the way up to 25,000 feet near the Taehwa Mountain research forest ground site. This ground site has sensors and many instruments measuring air quality. The reason we do spirals and have a ground site at this particular location is to better understand how human-caused pollution from Seoul mixes and reacts with the natural emissions from trees in the forest. The DC-8 also flew north and south along the peninsula at constant altitudes to map small particles, ozone and hundreds of other chemical compounds at various altitudes along the peninsula. We repeated the spirals near Taehwa three times (morning, noon and afternoon) and also performed two spirals over the ocean to the southwest of the peninsula.

While the DC-8 and Hanseo King Air flew at a variety of altitudes to sample pollution, the NASA B-200 flew at a much higher altitude (28,000 feet), where it collected remote-sensing data from above, simulating data collected by current and future orbiting satellites.

Unlike commercial aircraft flights where the goal is to get from place to place, the goal of research aircraft flights is to safely collect the best possible science data. This means that the people aboard research aircraft often experience very bumpy flights and g-forces that are not normally encountered on commercial aircraft.

During spirals (which can last for more than 20 minutes), the constant ascending or descending when the aircraft is turning in a circle can cause some people to feel queasy. Flying at low altitudes near the surface where the air is unstable can also make for a very bumpy ride. Those aboard are prepared for these conditions and many take anti-nausea medications or wear anti-nausea patches.

On Monday’s flight, however, those on the DC-8 lucked out – though it was moderately bumpy at times and they completed five spirals, the flight was not nearly as nausea-inducing as other air quality sampling flights some had experienced in the past.

Scientists in airplane.
Don Blake and Stacey Hughes (UC Irvine) operate the Whole Air Sampler (WAS) in flight aboard the DC-8. WAS collects air samples in canisters that are analyzed after the flight for their chemical constituents in the laboratory. Credit: NASA/Jane Peterson
Scientist working on airplane.
Jack Dibb (University of New Hampshire) collecting an aerosol particle filter sample from the Soluble Acidic Gases and Aerosol (SAGA) instrument to later analyze in the lab. Credit: NASA/Jane Peterson

The complicated airborne ballet our aircraft danced over the Korean peninsula yesterday could not have taken place without the cooperation of Korean air traffic control authorities.

Flying spiral maneuvers, rapidly changing altitude and repeating flight paths multiple times is very different from how typical commercial aircraft fly.

Our pilots, navigators and mission management worked closely with local air traffic control both before and during the flights to allow our aircraft safe operation in the busy airspace over the Korean peninsula.

“NASA is enormously appreciative for the incredible support we have received from the Korean Civil Air Traffic and the R.O.K. Air Force Air Traffic controllers [ATC],” said NASA atmospheric scientist Barry Lefer. “Our colleagues at NIER [National Institute of Environmental Research] have spent many hours working with the ATC authorities making our flight operations in Korea possible.”

Planning the Hunt for Science Flights

by Kate Squires / OSAN AIR BASE, SOUTH KOREA /

KORUS_flightplan3

Jay Al-Saadi of NASA’s Langley Research Center discusses preliminary plans for the NASA DC-8 and B-200 during a forecasting meeting. Credit: NASA/Jane Peterson

The science equipment is unloaded and jetlag has subsided for the KORUS-AQ team here getting settled in at Osan Air Base. Now the task at hand is to plan where and when the team’s three aircraft will begin gathering actual observations in the air.

Sounds simple, right? Wrong.

Pollution forecasting, air space restrictions, and weather predictions are all major factors that determine conditions for KORUS-AQ science flights that are targeting a range of air quality conditions over and around South Korea.  To further complicate matters, these conditions change constantly. Determining the best of all three conditions requires careful coordination. This coordination happens through daily morning meetings by flight planners, forecasters, and science instrument teams inside a hangar at Osan that serves as the KORUS-AQ’s headquarters.

DCIM100GOPROGOPR0312.

The forecasting group meets in the hangar to discuss Monday’s flight. Credit: NASA/Jane Peterson

I attended the first of these meetings on Saturday morning April 30 where the team reviewed the conditions for the first proposed flight on Monday, May 2. The question: would those conditions accommodate the science objectives of KORUS-AQ?

Pollution forecast considerations included looking at:

  • the pollution plume from Seoul and other pollution sources in South Korea like power plants,
  • air and dust inflow over the West Sea and upwind of Seoul
, and
  • biomass burning impacts (wildfires).

NCAR NO2 Model

Model run showing surface NO2 from point sources in Korea. KORUS-AQ observations in combination with these models will lead to better understanding of the factors controlling air quality. Credit: NCAR/Louisa Emmons

Another major requirement of the mission was negotiating with South Korea’s air traffic control authority on designing flights that collect the type of data the scientists need. The aircraft will be flying less than conventional patterns over the South Korean peninsula. For example, the DC-8 will fly spiral patterns over specific ground sites and may fly as low as 1000 ft. above ground level to obtain measurement profiles from different altitudes.

Mission managers, pilots, and principals investigators have spent weeks working with air traffic control to determine flight paths that will achieve science objectives while also keeping the many commercial passengers in busy jetways safe.

scienceteam_lobby1.jpg

Flight planning discussions took place in some unconventional places and times. Here the KORUS-AQ science team meets after hours in the lobby of the Turumi Lodge at Osan Air Base to work out flight plans to submit to the air traffic control authority. Credit: NASA/Kate Squires

As complex as the planning sounds, the team knows how to work together to achieve progress.

“A lot of preparation goes into our daily flight planning meetings. We hold them on the hangar floor so that all of the science team members can participate. Team members scattered across the many  ground sites in South Korea join these meetings online  This ensures that we have access to all considerations that might influence our flight decisions,” said Jim Crawford, lead U.S. scientist for KORUS-AQ.

The weather forecast shows an impending rainstorm early in the week, which could hamper flight efforts. But the team makes the  decision to fly Monday despite the storm.  

“While the conditions Monday are not ideal, these first flights will be difficult to coordinate. Better to give the pilots and scientists a chance to work through and identify difficulties and establish confidence with air traffic control on a marginal day so that we are ready to take advantage of the better sampling days ahead of us,” Crawford said.