By Zachary K. Erickson, NASA Goddard Space Flight Center / GREENBELT, MARYLAND /
The ocean is full of eddies – swirling water masses that are the ocean equivalent of hurricanes. In comparison with their atmospheric counterparts, eddies are smaller, longer-lived, and far more numerous: at any given moment, well over 1,000 eddies exist throughout the global ocean, with diameters typically between 30 and 200 miles (about 50 to 300 kilometers). On average they last for one or two months, but about 20% last for four months and a small fraction can last for over a year.
Several eddies dot the ocean off the coast of Ireland and Scotland. Waters at the center of the eddies can either be high or low in phytoplankton biomass (green or blue colors). For the full image, see here. Photo Credit: Norman Kuring/NASA GSFC.
We decided to locate the North Atlantic EXPORTS field deployment within an eddy because eddies tend to trap water masses in their core. This means that if we put multiple instruments in the eddy core, we can be pretty sure that they will stay close together. In a campaign involving dozens of individual instrument platforms, it is much easier to organize and understand the measurements when they are all near each other! Additionally, if the eddy core primarily contains trapped water, we can interpret changes in the water properties – such as a decrease in nutrient levels or an increase in biomass – as resulting from biological processes happening within the eddy, rather than from other external factors.
The main way we look for eddies is by using data from a constellation of satellites continuously orbiting the earth. These satellites use radar to very precisely measure the height of the ocean surface. On a global scale, these measurements help scientists track sea level rise. Locally, we use these measurements to track eddies, which either look like hills or valleys in sea surface height depending on if they are rotating in a clockwise or counterclockwise direction (in the northern hemisphere; this is flipped in the southern hemisphere). A sea surface “valley” is directly analogous to the low pressure associated with hurricanes, which rotate in a counterclockwise direction (in the northern hemisphere).
On a clear day, we got this fantastic satellite image of high biomass waters (red colors) moving around the eastern edge of our eddy. Arrows show the direction of the currents implied from sea surface height data.
Once we find an eddy, we try to predict how long it will last. For the EXPORTS field deployment, it was important to pick an eddy that was going to last for at least a month, which is the length of the main part of the deployment. We look at data from years past to identify characteristics of eddies that are long-lived, such as their size (bigger is better) and how symmetrical they are (circular eddies are better than oblong shapes). We also use numerical simulations to drop “particles” in a given eddy and track whether or not they appear to be trapped within the center or if they escape from the eddy. From these we generate a prediction for each eddy of how long, and how well, it will trap water masses within its core. For this experiment, we want a long-lived eddy that effectively traps water!
Positions of different platforms (most of them) during the EXPORTS field deployment! The ships and gliders can be steered through the water and also measure subsurface water properties, but the drifters just go with the flow. Some of the drifters have even been kicked out of the eddy (to the south)! On average, the sea surface height of the eddy is 10-15 cm higher than what we would normally expect at this location. Credit: NASA
After we have a small number of candidates, we need measurements from instruments in the water. It is very important to know what the eddy looks like beneath the surface, below where we have data from satellites. The EXPORTS project is centered around measuring carbon “export”, or how carbon locked up in biomass is transported from the ocean surface to the deep ocean interior. So, it is important that our chosen eddy effectively trap water masses down to about a thousand feet (about several hundred meters).
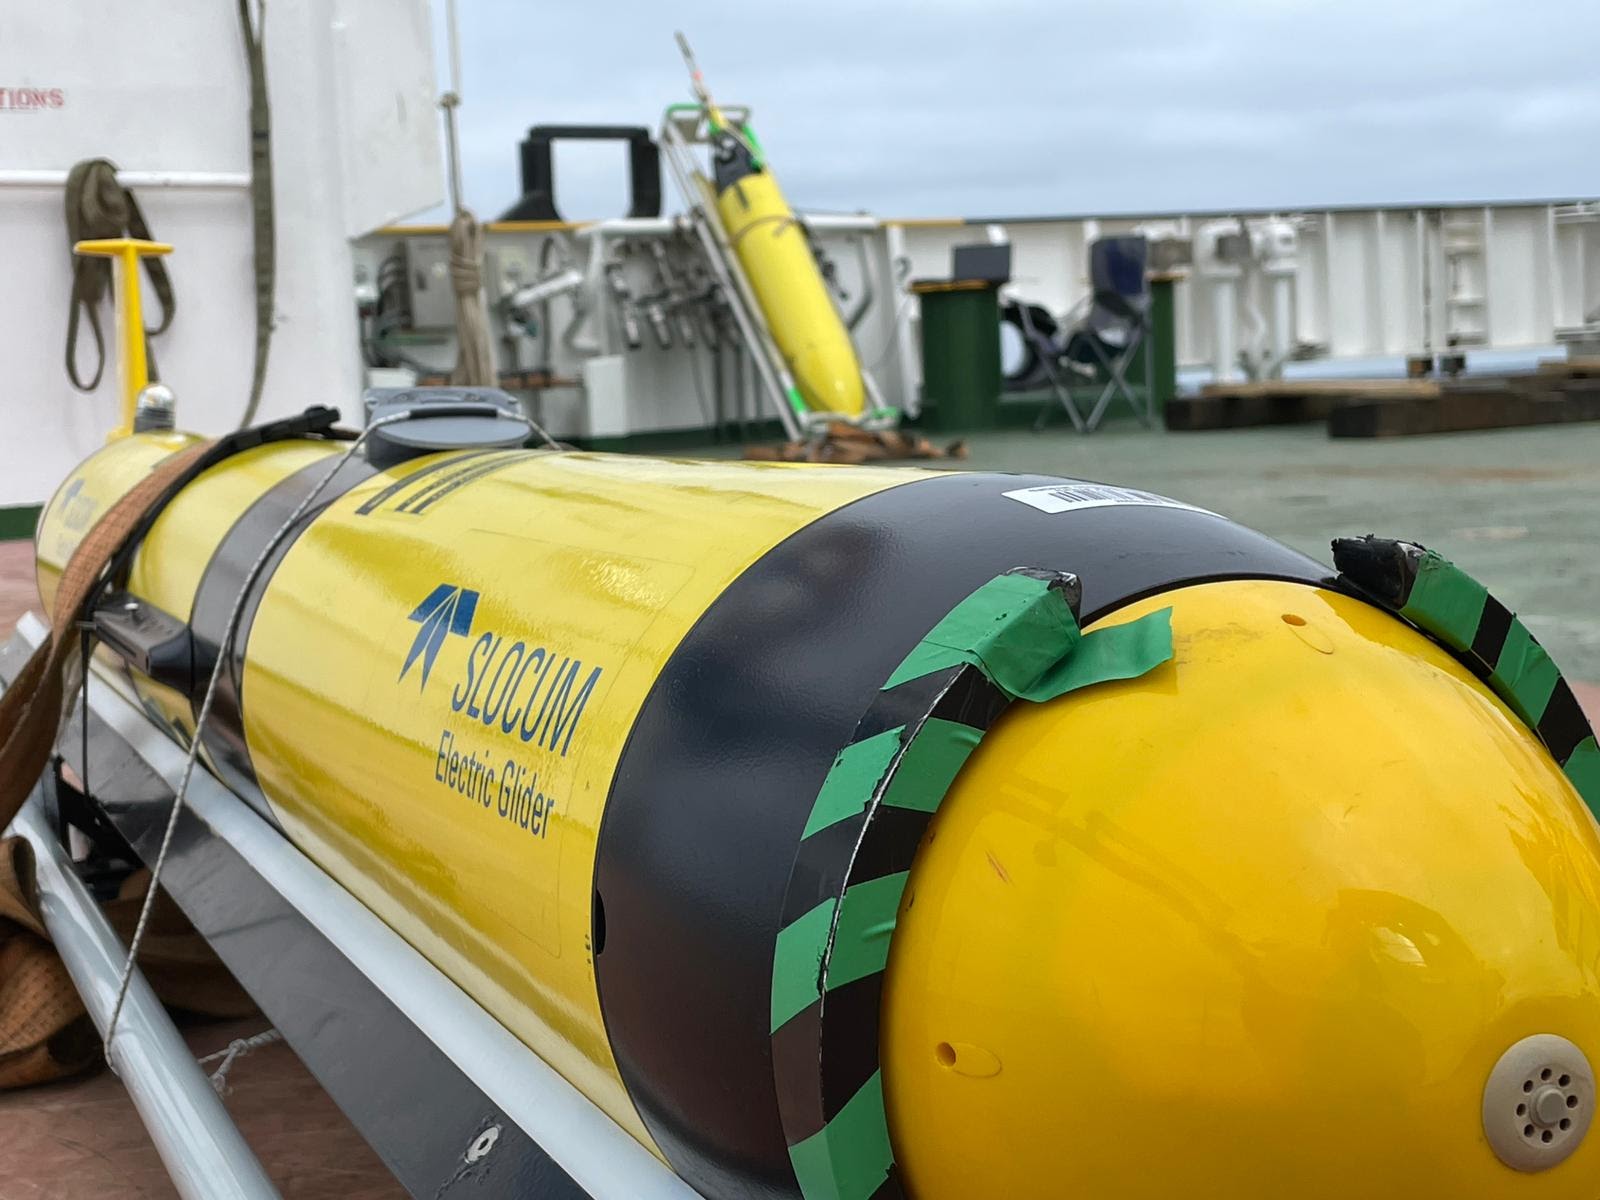
Initially, we get these measurements from ocean gliders, autonomous platforms that adjust their density to move up and down within the upper 0.6 miles (about 1 kilometer) of the water column, taking measurements of temperature, salt concentration (salinity), oxygen levels, and biomass along the way. Three gliders were deployed in early April, and these measurements were supplemented by data from three research ships in May, as well as the aforementioned dozens of platforms deployed within and around the eddy.
Throughout the course of the field deployment, a group of scientists on “shore duty” (including numerous institutions such as NASA Goddard Space Flight Center, University of Washington, University of Rhode Island, CalTech, University of California Santa Barbara, Woods Hole Oceanographic Institution, and the National Oceanography Centre in the United Kingdom) use all of these data to track daily changes in how our chosen eddy is evolving over time, making sure that we center measurements on the core mass of trapped water in the center. There’s still a chance that the eddy will break up, but two-thirds of the way through the mission, all evidence points to our having made a good choice in picking an eddy that will stay present at least throughout the course of this field deployment, and perhaps for many weeks or months afterwards!
By Sara Blumberg, NASA’s Goddard Space Flight Center and Inia Soto Ramos, Universities Space Research Association / GREENBELT, MARYLAND /
Pandemics can change the plans of nearly everything, including ocean research.
That’s exactly what happened with EXPORTS. In 2019, the original North Atlantic Expedition along with its active research projects were cancelled.
Despite the setback, the group kept meeting and sharing results. With strong support from our funding agencies, the EXPORTS team started looking for options to do the second expedition.
After a lot of challenges, the idea of a field campaign started to become a reality. In April, researchers from all over the world landed in England to begin two weeks of quarantine before setting out for the seas.
Here’s what happens when a group of scientists are asked to isolate:
1. COVID Testing
So many tests! Scientists had to ensure regular negative test results before they could get on the boat. The result? Three ships of crew all COVID free!
Video caption: Instructions on how to take a COVID test during quarantine. Video credit: NASA EXPORTS field campaign
2. Cheese making!
The daily supply of milk at the hotel was overwhelming for our scientists, so ideas and recipes started overflowing the group chat! One of the clever ideas was to use some of the pantyhose. Yes, pantyhose have a use in oceanography.
Pantyhose are used to hold the filter pads that go in liquid nitrogen to keep them very cold until samples get processed. Dewars, a double-walled flask with a vacuum between the walls, have a metal container that sometimes issues when opening and closing. We found that the filter pads can escape and fall in the bottom of the liquid nitrogen bottles. To prevent this ,we put the histoprep (with filters) capsules inside the pantyhose leg section and tighten it with a string. This keeps the filters safe, making it easier to pull out.
After a bit of online DIY searching, EXPORTS researcher Sue Drapeau debuted her hotel-quarantine-made paneer cheese. While that surely made good use of the extra milk, it surely sparked a few complaints of spoiled milk smells around the hotel!
A look at some of the cheese made during the EXPORT quarantine. Credit: Sue Drapeau
3. Knitting Hats
Biological oceanographer Colleen Durkin had a quarantine goal in mind – knitted hats. During her two weeks of isolation she knitted a hat for each member of her team. She dubbed them the “Mesopelagic Fade” and were all ready when they set sail. In knitting jargon, a “fade” is a method for transitioning across a color gradient. The mesopelagic is the depth gradient that we are studying.
Finished my 2 week quarentine project just in time. “Mesopelagic Fade” series for the EXPORTS trap team. pic.twitter.com/0wwajGEiRW
Tweet caption: Researcher Colleen Durkin’s finished hats for her team. Credit: Colleen Durkin
4. Crafts
To bring everyone together, researchers spent their time making cards, painting, and doing trivia nights. They also engaged in a virtual Plankton Action Drawing Workshop with Cynthia Beth Rubin. Cynthia is a digital/analog artist, and has been drawing plankton with the Menden-Deuer Lab for many years and incorporating it into her own work.
One of the many artworks created during the EXPORTS quarantine. Credit/artist: Jordan SnyderArtistic drawings stemming from taking a phytoplankton drawing class during the EXPORTS quarantine. Credit/Artist: Nick Baetge
5. Weather-watching
Scientists spent a lot of time looking out of their windows. The weather ranged from snow sightings, beautiful spring days and a continued question of when the quarantine would be over.
For the researchers, the quarantine impacted everyone differently. Stay tuned for more personal accounts of what it was like to do field work while away from loved ones.
Researchers enjoying the views of isolation for two weeks while algae photosynthesize! Credit: Lee Karp-Boss
By Sara Blumberg, NASA’s Goddard Space Flight Center and Inia Soto Ramos, Universities Space Research Association / GREENBELT, MARYLAND /
When we talk about climate change, we tend to think of lush forests with giant trees that passively trap carbon dioxide from the atmosphere and use them for food in a process called photosynthesis.
On May 13, 2021, following some rough weather in the northeastern Atlantic, EXPORTS researchers aboard three ships (Discovery, James Cook, and Sarmiento de Gamboa) were taking advantage of sunny weather and calmer seas to collect samples and hope for good satellite overpasses.
The ocean might not have giant trees, but it has microscopic, little plants known as phytoplankton that do the same thing.
In a rapidly changing planet, carbon continues to play a big role, especially in altering our ecosystems. The NASA-led field campaignExport Processes in the Ocean for Remote Sensing (EXPORTS) wants to learn how this chemical element is impacting the ocean, especially in a place right beneath its surface called the “twilight zone.”
This past month more than 50 scientists from all over the world have been conducting large-scale studies from the surface of the twilight zone in the Northern Atlantic.
So why is the twilight zone so important? In short, researchers don’t know much about it.
Carbon dioxide dissolves in the ocean, making it available to hungry phytoplankton that, in the presence of sunlight, will bloom. In some cases, these blooms will paint surface waters in beautiful shades of green and brown that can be observed even from space!
While phytoplankton keep getting healthy and chubby, other sea creatures such as zooplankton will feast on them. Eventually, carbon is incorporated in the ocean food chain and is released in the form of organic matter via decay (think feces)!
Phytoplankton seen under the microscope! Credit: Laura HollandA close-up view of zooplankton and detrital material living in the Twilight zone. Credit: Deborah Steinberg
Some of that decay material gets reused within the surface ocean, while others will sink to where sunlight fades –the twilight zone! During this process, carbon can get reused, ride with the currents, go up and down the ocean along with creatures that migrate along the water column, or simply make it to the seafloor where it may be stored for years to millennia.
Understanding how much carbon is taken up and exported to the deep ocean is a key question for understanding climate change and improving model predictions.
Back in 2013, a group of oceanographers and scientists alike met at the University of California, Santa Barbara and drafted a science plan for a field campaign mission to study how carbon moves from the ocean surface to seafloor.
That science plan was published in 2015 after a rigorous and extensive scientific review. EXPORTS became a reality in 2018 when 18 projects, dedicated to address the science plan questions, were funded by the NASA Ocean Biology and Biogeochemistry and National Science Foundation.
The first phase of the EXPORTS project was a successful field campaign in the North Pacific Ocean in 2018 led by a stellar team of scientists, two University-National Oceanographic Laboratory System vessels (R/V Sally Ride and R/V Roger Revelle) and state of the art technology.
On April 22, 2021, the EXPORTS North Atlantic Expedition began with two research vessels named the RRS Discovery and RRS James Cook. The shipsalso deployed gliders, drifters, moorings; other edge-cutting oceanographic instrumentation began field preparations.
Deployment of the Wire Walker, an instrument that sampled up and down the water column while drifting with the currents and generating its power by waves. Credit: Deborah Steinberg
The EXPORTS team was joined by Woods Hole Oceanographic Institution’s ocean twilight research program onboard the Spanish vessel R/V Sarmiento de Gamboa. The galore of technology is represented by a diverse science crew that will study this region for about 30 days. Research will range from microscopic creatures, such as viruses and bacteria, to the dynamic circulation and biogeochemical processes driving the carbon cycle during the spring blooms in the North Atlantic ocean.
Follow along as NASA details their journey, which started with two weeks of quarantine.
NASA EXPORTS unloading technology for the field campaign. Credit: Filipa Carvalho
Madeline Beck, Undergraduate Student in Environmental Science, Montana State University
Being part of a NASA research team is an exciting experience! Knowing our work will correspond with further research endeavors and help validate remotely sensed measurements makes us feel like part of a greater effort and team.
The research site is in a beautiful part of Montana. It feels remote and reminiscent of earlier times, and it is a new area of science for most of us. Being a part of larger research is always exciting and offers opportunities to learn and expand on our own knowledge and being able to do so in such a different, harsh environment offers new challenges that we must work through.
The exposed landscape and high winds of prairie environments create drifts, buried ice and other challenging features for the SnowEx team to investigate. Credit: GEOSWIRL / Montana State University
When we show up to do research, we often must adapt to the day’s weather conditions. While some field days are sunny and warm with a light breeze, others have been frigid with wind too loud to hear others speak. This is one of the most difficult, but most gratifying, parts of fieldwork and causes you to think on your feet. Our field duties include digging snow pits and taking the full suite of pit measurements, walking snow-depth transects with a probe and GPS unit, assisting other students with UAV flights, and downloading data from the many sensors.
While many of us in the class had dug either snow or soil pits in the past, none of our previous experience was able to prepare us for the snow we found at the research site. “Ice” is a better word for the “snow” that we found, and even a day after new snow fell at the site, the snow became hard and solid. We also found ice layers in the snowpack from periods of melt and refreeze. Digging the pits themselves, although all relatively shallow, proved to be back- or shovel-breaking work! It was interesting coming from a background where I had dug snow pits for research or recreational use, and seeing how different the layers and characteristics of snow pits at a plains research site could be.
Depth transects were an informative way to see how variable snow accumulation and retention were across the different field types. In areas of high stubble, snow was retained longer and in greater amounts. However, field’s location was also important due to a windbreak on the western edge of the field that kept snow from being blown around so much. Additionally, helping other students and researchers with UAV flights was beneficial, and although I fly UAV’s frequently for my own research, the research site’s harsh environment added more factors for the flights to go wrong, and quick troubleshooting was required to keep operations going. Lastly, learning to operate scientific loggers and make sense of the data collected was a great skill to gain. Seeing how raw data is collected and transformed to make sense of the readings was beneficial because we could then connect the data we had collected to the environment we had seen in person.
Learning in a field environment is drastically different from a classroom setting and helps you learn to adapt quickly and efficiently. In a classroom, you can plan in extreme detail, but something always seems to go against the plan while at a field study. However, having the skills to adapt and remain levelheaded is something you can only pick up through conducting research, and it is a skill that takes time to acquire. This project has helped me better plan for the unexpected and not let malfunctions impede my ability to continue carrying out research. It has also taught me the importance of working with others across different academic and scientific disciplines and that every individual brings a unique and beneficial perspective to the table. I know the ability to develop these friendships and contacts so early in my own academic career will benefit me for years to come and will help me become a better researcher myself. Being a part of the NASA SnowEx team has been an influential and enjoyable opportunity, and I look forward to seeing where these experiences will take me in the future.
Max Smay, Undergraduate Student in Earth Sciences, Montana State University
Being part of the NASA SnowEx project has been a very cool and unique experience compared to classes I have taken. It is cool to know we are part of a larger effort affecting real-world applications. Learning how this type of work takes place in the “real world” has also been very valuable to me and motivated me to find similar applied, hands-on work after getting my degree.
The days in the field are coordinated and busy, but they have not been very stressful or overwhelming. Our team seems well suited to assigning the day’s tasks and everyone seems to be having fun. My favorite parts of the field days have been reconvening and talking about what difficulties and successes everyone had in the field, and learning about new ways to collect and process data. When we’re done collecting data, I am usually dog tired and have some relaxing evenings as I appreciate being out of the cold. Learning in this environment is great compared to a classroom: first because there is much more autonomy, and second because we get to be outside and active.
With COVID, it has been harder to make connections and friends in the classroom, so this project has been a welcome way to connect with peers in a more active environment. I have been very appreciative that I get to take this class because of this, and the reasons mentioned above!
Mitchell Burger, Undergraduate Student in Earth Sciences, Montana State University
Being a part of a NASA research team is an amazing opportunity to get experience collecting data in the field and learn about the intricacies of a large-scale research project like SnowEx. It has brought us out to a part of Montana that we may not have seen before or thought about if we were to drive through the area. After some field days at the CARC in Moccasin, I have a new respect for and curiosity about prairie landscapes and their processes. Before going to the study site, I thought collecting data there would be straightforward and simple, but quickly learned it was anything but simple. It has been so cool to see the effects that wind has on snow cover in this environment and think about its repercussions for the hydrology of the area.
A day at the CARC begins with a nice drive from Bozeman to the center of Montana, where the CARC is located. Once there, we go over the plans for the day, which were settled upon in class earlier in the week. We all then go out and complete our tasks, such as digging snow pits, checking on the soil moisture sensors, doing snow depth transects, and helping with UAV flights. Doing snow depth transects has been my favorite part of the fieldwork, as I get to see the variability of snow depth across the different crop types firsthand. Once everything is done for the day, we all caravan back to Bozeman.
Learning out in the field is different from the classroom in that we learn from what is around us and talk about processes that are occurring while we are there. For example, before we dug our first snow pits on “the berm”, we discussed why it was covered with so much debris and how the debris may have increased snow melt until it was covered with snow again. When digging snow pits in any location, I always try to learn something new from the snowpack. In this environment though, we encountered some very unique snowpacks, and I think it forced many of us who are used to mountain snowpacks to step out of our comfort zones and ask new questions.
Caitlin Mitchell, PhD student in Land Resources Environmental Sciences
It is interesting to try to distinguish between working on a NASA research team and any other research team. Some noteworthy items are the safety forms and instruction protocols, as well as the data record-keeping guidelines. The latter is interesting because it’s a constant reminder that the data we collect is part of a greater dataset – one being culled for ease of transcription and interpretation by project members outside of the group we work with in the field. It creates a sort of data language that we all share. Curating and documenting data products is also a focus of my primary research project (NSF MT EPSCoR CREWS). With “big data” becoming more commonplace, it makes sense that these items, or aspects of them, are a focus across different government-funded research projects.
A day in the field on the NASA SnowEx project for me, as a student with additional motivations to investigate snow in prairie environments, includes taking samples of snow at points where we map snow depth across the site and in snow pits we dig. I am interested in the water isotopic values of the snow and how they change over time and space in a prairie environment, with the motivation to better understand snow contributions to soil water for crop uptake and nutrient cycling. The samples I collect are analyzed in the lab isotopic values of the hydrogen and oxygen atoms that make up the snow water molecules. The variation in these values tell us about the origin of the water molecule as well as transformation processes it may have undergone, such as sublimation.
My favorite part of the research so far has been seeing and feeling the changes in snow depth and density along these transects as I walk them. I look forward to placing the water isotope value results at the GPS locations they were sampled to see if and how the snow is changing chemically across this landscape. I have always been a more visual learner, so witnessing things unfold in real time and experiencing them in the field really resonates with me and enhances my understanding of what is going on in the environment. Experiential learning opportunities like this one, and like most research that involves field sampling and collection, are incredibly valuable for building relationships among the people involved, as well as building a robust skill-set from accurate data collection to interpretation and understanding for each individual.
SnowEx researchers Caitlin Mitchell and Marika Feduschak measuring the physical characteristics of the shallow prairie snow. Credit: GEOSWIRL (Geospatial Snow, Water & Ice Resources Lab) / Montana State University
Ross Palomaki, 2nd year PhD student in Earth Sciences
I have really enjoyed working at the CARC SnowEx field site. Most of my personal and research experience with snow has been in the mountains, and this prairie site has offered a new perspective on snow as a water resource. Seeing and measuring the drifted snowbanks in person has prompted some interesting discussion on spatial variability and sensor resolution.
There is not really a “typical” day at the CARC – most of our activities are dictated by the weather. I am part of the unmanned aerial vehicle (UAV, or drone) operations team, and our Structure-from-Motion photogrammetry (using photography to map distances between objects) flights have been shut down numerous times by wind and blowing snow. It’s a great feeling to get a clear and (somewhat) calm day up there and complete all the planned flight missions.
I am looking forward to the upcoming data analysis, especially the opportunity to compare our site to the sites in the mountains. Hopefully we will have the opportunity to meet our fellow SnowEx teams in person someday.
Like so many other things, NASA’s SnowEx 2021 looks a little different than usual this year. But one thing is business as usual, and that’s the participation of undergraduate and graduate students.
Students play a pivotal role in SnowEx, from suiting up for data collection to crunching the numbers afterward. The field sites become a classroom for the students too – as they measure, record, process and analyze real data, they learn skills for their own research work.
We invited some of the students from Montana State University to share their experiences in this year’s campaign at the Central Agricultural Research Center (CARC) site. In addition to sharing what their typical days in the field look like, they shared some of the new experiences and discoveries they’ve had, and what they’re enjoying most.
Dr. Eric Sproles, Assistant Professor of Earth Sciences, Montana State University, Site Lead
Wow – this NASA SnowEx project has provided some amazing opportunities for hands-on learning for students and investigators alike. The snow-centric research at Montana State University has primarily focused on mountain snowpacks. Working in the prairie is different in many ways. First, it is much more variable than I imagined. Because of wind and vegetation, snow drifts can be over 3 feet deep in one location, and only 20 yards away you find bare ground. This allows you to really think about the effects of wind and vegetation in this food producing region of the world.
Secondly, measuring the snow in these areas is incredibly challenging, and makes you rethink the way you usually do things. Being forced out of your comfort zone has helped broaden my perspective as a scientist and mentor. We have some amazing students at Montana State, and in these types of hands-on environments, I think I learn as much from them as they do from me.
Leading this SnowEx project has allowed me to better connect with fellow SnowEx Leads, and also other scientists from across the United States with an interest in prairie snow. These professional relationships underscore the value of team-based approaches to big-picture science.
Andrew Mullen, Master’s Student in Earth Sciences, Montana State University
The 2021 SnowEx field campaign has been a unique experience because I have never before participated in such a widespread, coordinated field data collection effort with so many different moving parts. Although we are physically distanced from the other research groups, it feels like we are part of one cohesive effort with the same objectives in mind. We are collecting a vast array of data types using a variety of methods, and I have enjoyed thinking about how we can link different types of data to answer specific questions. Our work here feels meaningful because this data is being used to develop and validate tools and methods that will improve how we monitor snow across the globe for years to come.
My role at the CARC field site has mainly been in conducting UAV-based broadband albedo (reflectivity) surveys of our 1 km x 1 km study area. With these UAV flights, I am mainly interested in observing the spatial variability in albedo across the field area that is composed of many different types of crop cover and microtopography that have a significant impact on the distribution of snow and snow properties. I have also been a part of the manual snow surveys (snow pits and snow depth transects, or predefined lines we measure along) where we are able to observe this variability firsthand.
The nature of this landscape forces you to think differently about processes of snow accumulation and loss that don’t get much attention in the literature. I feel that there is a lot of potential for new and impactful discoveries and insights to be uncovered here, with the quantity and quality of data we are collecting in this landscape that composes such a large portion of the Earth’s land surface. Something I have taken away from this field campaign is an appreciation for this type of landscape both in terms of the complexity in processes as well as its natural beauty.
SnowEx researchers Andrew Mullen, Eric Sproles, Caitlin Mitchell, and Ross Palomaki finishing up a snow pit profile. Notice how the snow goes from 1 meter (3 feet) deep to almost nothing over relatively short distances. Credit: GEOSWIRL / Montana State University
Guy Brisman White, Undergraduate Student in Earth Sciences, Montana State University
It is a very cool experience to be a part of something that is being used for a larger purpose. As an undergraduate student, I feel that a lot of the work I do is basic and mostly for my own education, so I am happy to contribute to a larger project like SnowEx. Another key experience is learning how data is collected. I have used many different data types throughout my college career, and seeing firsthand how hard it is to record quality data made me appreciate many of the sources I have taken for granted.
Our typical fieldwork days include a long but beautiful drive on often snowy and icy roads. Once we arrive at the site, we have a quick meeting to lay out the fine details of the plan and break into different pairs or groups to complete the tasks. Snow pits were labor-intensive but familiar to me, so I spent the most time working on them. Just a few of the other great learning experiences I had included obtaining weather data from stations, transects, and learning about collecting albedo with drones.
Kendall Wojick, Master’s Student in Land Resource and Environmental Science, Montana State University
Being a part of a NASA research team has been an amazing opportunity to test my fieldwork and teamwork skills in a new setting. I enjoy the responsibility and organization of the data recording set up by NASA. Seeing how they structure their data documentation has improved my personal data housing practices for my graduate studies.
A day in the field for us looking at prairie snowpack is really fun and unique compared to the other mountainous sites in this study. While we don’t get to ski in to our sites, we do get to interact with a beautiful prairie landscape and laugh at how impressive and unexpected the pits we dig are. With the residual berms (flat ridges) of snow that build up near large windbreaks, there are some hefty ice lenses (“bubbles” of ice in rock or soil) from months of melt and freeze patterns that we have to bust through. In order to break through these thick lenses, we even had to employ a “Montana Sharpshooter”, a weighted spade-shaped shovel, that was invented to bust through gravelly concrete-like soils in central Montana. It is always a team effort and a lot of fun to dig and study these pits. I am a soil scientist by trade, so it is an interesting thought experiment to compare how the temporary layers of snow develop compared to the longer-lasting layers of soil. I’ve realized how much snow is truly present on the prairies and what a difference capturing it with wind breaks and stubble can make for dryland agriculture. I feel that the prairies often get overlooked when it comes to snowpack so I am excited that it is included and appreciated in this study.
“This is what happens when you are expecting 75 – 90cm (2.5 – 3 feet) of maximum snow depth, and you get 200 cm (6 feet),” said Eric Sproles, site lead for the Montana SnowEx location and assistant professor of Earth Sciences at Montana State University. SnowEx researcher Zach Miller adjusts his instruments to compensate. Credit: GEOSWIRL / Montana State University
After a long day of collecting data – which involves a three-hour drive for us – I love getting to know my research partners better, often playing bluegrass on the drive home with a chance to take in the beautiful Montana landscapes. There is something about a shared passion for these landscapes and the open road that opens people up so we can joke, laugh and discuss everything from silly stuff to deep existential ideas about life and existing on this floating ball of water and rock we call Earth. This NASA project is about as close as I’ll get to being an astronaut, but it does make me think about the incredible progress we have made in remote sensing since NASA was formed in the 1950’s and how it has truly moved forward one small step at a time. Every aspect of a pit we collect seems so small in the moment, but when we repeat that a few hundred times, we have something robust. I can’t wait to see the results of this field season and the accuracy of the SAR sensor, and how this mission moves our collective capabilities forward.
Scientists gather field samples and data from a marsh in coastal Louisiana. Credit: Elena Solohin
By Elena Solohin, Florida International University /NEW ORLEANS, LOUISIANA/
My colleague, Emily, and I, with Florida International University’s Wetland Ecosystems Research Lab, kicked off our 2021 field season with a trip to the Mississippi River Delta to conduct research for NASA’s Delta-X project. We met up with a team of scientists from Louisiana State University and spent two weeks conducting fieldwork across the vast salt meadow, cordgrass marshes and freshwater wetlands of Louisiana’s Atchafalaya and Terrebonne Basins.
More specifically, we set out into the marshes by boat to collect soil cores and biomass (organic matter) from below- and above-ground, and to measure marsh elevation. The data we collected will contribute to Delta-X’s main goal – to project future wetland vulnerability along coastal Louisiana under various scenarios of sea level rise and sediment supply using state-of-the-art remote sensing tools, field observations, and modeling approaches across the two basins.
Solohin gathering vegetation samples as part of her field work in coastal Louisiana. Credit: Elena Solohin
Our field work was both exciting and challenging. Our boat rides out to the sampling sites were their own adventures especially with the windy, bumpy, and at times, foggy conditions we encountered. When it was time to get out of the boats, we met our next obstacle – navigating the wetlands, dominated by tall cattail, on foot. Walking through the swampy ground is challenging for even the most experienced wetland scientists!
While trying to keep six feet apart from other teams, we took photographs of the wetland vegetation and recorded water levels. The photographs offered a bird’s eye view of the marsh landscapes and vegetation diversity. While we were working, we also marveled at the blue, over-arching sky, the teeming wildlife around us – including a few sets of beady alligator eyes sticking out of the marsh — and above all, the unique beauty of Louisiana’s coastal wetlands.
Wide view of coastal Louisiana wetlands taken by Delta-X researchers on an overcast day in March. Credit: Elena Solohin
After each day of hard work, we were glad to have some time to take a break, even if it was in the same marshy area we’d been working. Now, we’re looking forward to processing the samples we collected to generate the data needed to help understand and predict future wetland vulnerability along coastal Louisiana.
Solohin and a colleague relax in the marsh after a hard day of field work. Credit: Elena Solohin
Alligator spotted by Delta-X field team in coastal Louisiana. Credit: John Mallard
By John Mallard and Tamlin Pavelsky, University of North Carolina /NEW ORLEANS, LOUISIANA/
Cruising through a bayou during recent fieldwork in the Mississippi River Delta, our boat driver casually pointed out an alligator and zoomed on by without slowing. After seeing us scramble to get out our phones to take a picture, though, he realized that perhaps these scientists from the piedmont of North Carolina were a bit less used to seeing alligators than the locals of southern Louisiana, and obliged us by circling back around for some pictures.
This alligator is one of the many species of animals and plants that depend on the unique habitat provided by the bayous, marshes, lakes, and rivers of southern Louisiana. Equally dependent on them are people; we rely on them to protect inland towns from tropical storms, support recreational and commercial fishing, and provide transportation networks for global shipping. With this vital role of the region in mind, DeltaX is measuring how water and sediment move through the delta to learn how and why marshes are changing in the area.
Our team, Tamlin Pavelsky and John Mallard from the University of North Carolina, was in the delta in early March to install sensors that measure water level in the marshes, bayous, and lakes. DeltaX is measuring the water surface elevation and extent via aircraft (NASA’s AirSWOT and UAVSAR), which allow us to get measurements across a very large area. Our sensors provide a check on these airborne measurements at the points where we install them. This process of checking our airborne measurements against points on the “ground” is called “validation,” and is a crucial part of using airborne measurements.
Of course, fieldwork had to be modified due to COVID. Prior to fieldwork the team quarantined at home and then formed a pod for the trip. Instead of flying down and buying groceries on site, we rented a car and packed two coolers full of food for the week. We wore masks at all times when we were outside of our accommodations. We self-monitored for COVID symptoms every day. Although these precautions added some time to our work, we were extraordinarily grateful to UNC and to NASA for helping us figure out how to work safely and successfully!
Tamlin Pavelsky installs water sensor for Delta-X project in coastal Louisiana. Credit: John Mallard
The sensors we installed are pressure transducers. When underwater, they record the pressure of water pushing on a membrane inside the sensor, and then we use that weight to determine the depth of water above them. The sensors are only about the size of a cigar, but they can record tens of thousands of measurements without running out of battery. The sensors we installed in March will stay in the field through Fall, when we’ll return to retrieve them and download the data.
Our work was done from a small motorboat whose flat hull was specially designed to work in shallow water. On a typical day we would meet our hired boat driver at a local boat ramp to put the boat in the water just after breakfast and be back at the boat ramp by 3 p.m. after installing 5-9 sensors. On board, we had about a dozen 10’ lengths of PVC taking up a whole side of the boat, along with our sensors, tools, and food and snacks for the day.
John Mallard pushing PVC pipe into the mud to install a sensor for the Delta-X project. Credit: Tamlin Pavelsky
We would navigate to pre-determined locations to install sensors, which were usually on the edge of the water, and the driver would gently run the bow aground to keep us in place. Then we pushed a PVC pipe into the mud as far as we could by hand and finished the job with the post pounder.
We needed to get them deep enough into the mud so that a slit cut in the side of PVC was below the water line and would allow water into the pipe. We tied the sensor to the cap of the pipe using Kevlar cord that is highly resistant to wear, and hung it inside the pipe so that it was below the water surface. At each location we took measurements of the height of the pipe, the length of the cord, and depth of the water so that we could later translate the depth of water measured above the sensor to the actual depth of water at that point. After installing the sensor, we marked the location with a handheld GPS device and moved on to the next site.
On some days we only traveled a few miles and had to take the boat out of the water multiple times to drive to different boat ramps, but on our last day we put in at a single ramp and traveled more than 70 miles across the lakes and bayous of Terrebonne Bay. The weather was sunny, low 70s, and we had lunch on a narrow beach by an inlet separating the Gulf of Mexico from the bay. We watched birds and dolphins fishing for their own lunch of small fish and crustaceans in the inlet. It was a wonderful break at the end of a successful field trip. After a challenging year with so many disruptions of our work, among so many other things, it was such a relief to feel like we’re starting to be able to “get back to work”!
LSU team (Andre, Brandon, Amanda) measuring accretion at their feldspar marker horizon station in coastal Louisiana for NASA’s Delta-X. Credit: Amanda Fontenot
By Amanda Fontenot, Louisiana State University /NEW ORLEANS, LOUISIANA/
Although most of my work happens in the lab, office, or home, field days are some of the most important days of the year for my research. “Going to the field” is when we get to physically visit the wetlands that we spend so much of our time describing, researching, and caring about. Field days can require a lot of effort and time to execute, but they can also be a beautiful time to get out of the office and even have some fun with our colleagues.
I am a graduate student at Louisiana State University (LSU), and I am working towards my Masters of Science in Coastal and Ecological Engineering. I work with Dr. Robert Twilley in the Coastal Systems Ecology Lab at LSU, and my thesis research falls under NASA’s Delta-X Project. In October 2019, Dr. Andre Rovai and I laid a total of sixty-nine feldspar marker horizons at our seven Delta-X field sites in order to measure short-term sediment accretion. This March we traveled back to our markers in the Atchafalaya and Terrebonne basins of coastal Louisiana to measure this accretion.
We made these “markers” by pouring custer feldspar (a fine, white, mineral powder used in ceramics) on top of the soil surface. We use this material because it stays intact and provides a clear indication of when the experiment started. Over time, a soil layer forms on top of the white marker from both plant production and material that is deposited from rivers and the Gulf of Mexico. After placing the marker, our team comes back every 6 months and measures how thick that newly formed soil layer is on top of our marker. We then can divide that number by how many days it has been since we laid the marker, and we end up with a short-term sediment accretion rate. This rate is important in understanding how these wetlands will compete with increasing sea levels and local subsidence that threatens a majority of Louisiana’s coastal wetlands.
Most field days start pretty early in the morning, and this campaign was no exception. Our LSU team (Dr. Andre Rovai, Brandon Wolff, and I) left campus around 4:30 a.m. and headed to the boat launch to put our boat in the water. Since these sites are pretty mucky and we need to be careful to not step on our markers, we also travel with an airboat and our handy dandy airboat operator, Cade. After the boats are in the water, we drive to our sites and get to enjoy a nice sunrise on the water.
Depending on the morning, we usually get to our site around 9:00 or 10:00am and huddle up for a game plan. For this campaign, we needed to complete four tasks at each site: 1) measure accretion on top of our feldspar markers, 2) collect 50cm deep soil cores that help characterize the site, 3) deploy two water level recorders that collect data every 15mins, and 4) measure marsh elevation at varying points using our RTK instrument, which uses satellite-based positioning systems like GPS to estimate the elevation of a point. In the morning, we usually discuss in what order we might finish these tasks and who is in charge of each part of the process.
Most days, I am the one measuring and recording our accretion numbers for the feldspar markers. In order to minimize how much we disturb the soil around and within our feldspar marker, we use what’s called a “cryo-coring” technique – which we have affectionally named collecting “marsh popsicles.” In the field, we push a long, skinny copper pipe into the soil where we previously laid our marker and pump liquid nitrogen into the pipe. Since the liquid nitrogen gets so cold, some of the soil freezes around the pipe and ‘Voilà!’ we pull up our “marsh popsicle.”
“Marsh popsicle” with white feldspar marker ring. We measure the distance from the top of the popsicle to the beginning of the white marker. Credit: Amanda Fontenot
On our popsicles, we see our feldspar marker as a white ring around the muddy popsicle. I measure the distance from the top of our popsicle (marsh surface) to that white ring (feldspar marker) with calipers and record it in my field notebook to look at later. Usually by the time we collect all the popsicles we need at the site, we go collect our soil cores and then are ready to eat lunch. We bring our own lunch to enjoy but what’s almost guaranteed is a plethora of light blue Gatorade and Andre’s signature glass bottle of Coke.
After lunch, we continue working on the other tasks for a few hours and try to help out the other field team from Florida International University (FIU) if we finish up before them. When we all finish up our field tasks, we start the long journey home. We pack up our supplies, put samples on ice, change clothes if we got too messy or wet in the field – those boat rides can get really chilly otherwise — and drive the boats back to the launch. At the launch, we get the boats back on the trailer and drive back to LSU, arriving later in the evening.
LSU team (Andre, Brandon, and Amanda) in foreground at their feldspar station with the FIU team (Edward, Elena, and Emily) in background. Caption: Amanda Fontenot
Depending on the weather, we might go out to another site the next day, meaning a meeting time of 4:30 a.m. back at the school. After we finish at campus, I race home to shower, eat dinner if we haven’t stopped somewhere on the drive back to Baton Rouge, clean my field clothes, and jump in bed to do it all over again the next day. Each team member plays an important role in the field, whether that be holding open bags to store samples, operating our liquid nitrogen tanks, or making sure everyone stays hydrated while we work. Although field days can be quite tiring and stressful, the work that our team accomplishes not only works towards the goals of the Delta-X project but increases the general knowledge of Louisiana’s coastal wetlands and the ecosystem services they provide.