Preparing for Landing: NASA’s S-MODE Wraps up Last Week of Experiments

By Dragana Perkovic-Martin, Principal Investigator for DopplerScatt at NASA’s Jet Propulsion Laboratory // SOUTHERN CALIFORNIA //

11/02/21

Yesterday was a hard down day for the team – everyone needed a rest after a very active week before. The hard down days are in NASA airborne rules and ensure that fatigue does not set in and keep everyone’s safety  the top priority.
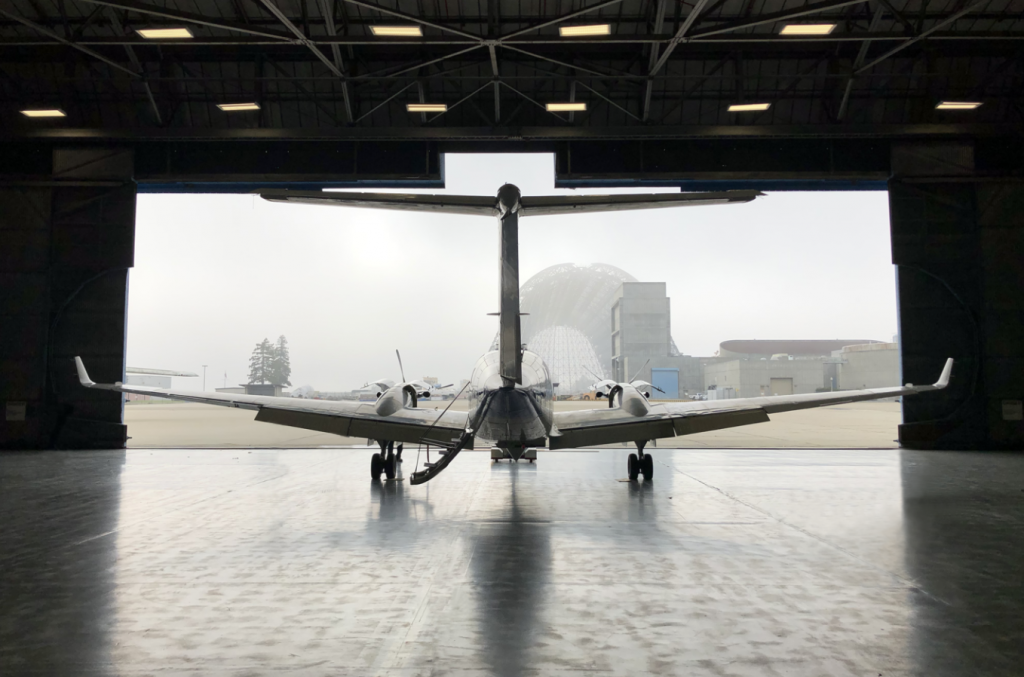
The NASA King Air B200 and the early morning fog at NASA Ames Research Center.
Spooky! NASA King Air B200 and the early morning fog at NASA Ames Research Center. Photo credit: Alex Wineteer / NASA JPL

To fly or not to fly … Today is supposed to be a good day for optical measurements but the pesky fog is really not willing to leave the area of S-MODE operations. We sit and wait for updates from the ship, satellite imagery and forecasts. In the meantime, we are using the Saildrone measurements of wind speed in the area of interest to determine if it’s worthwhile to operate DopplerScatt. The winds are very low. The hourly reports are telling us that the winds have been below DopplerScatt’s threshold for the whole morning, reporting wind speeds of one meter per second. At this wind speed the ocean surface is very still, so still that it may look like a mirror. This is bad news for radar signals bouncing off the surface as their strength depends on the surface roughness. No dice for DopplerScatt today, and the same decision was made for the MOSES and MASS instruments on the Twin Otter. 

11/03/21

Remember that pesky problem with the monitor from last week? I overnighted a replacement monitor for the DopplerScatt team since yesterday was a doozy with no flights, they decided to swap out the monitor and keyboard on the plane. Trouble is they did not test that it worked. We just thought, “well what could go wrong, it’s the same model.” What do you know, it did go wrong! I’ll spare you the details and the frantic messaging between myself and the operators, but after some time they realized that the power cable was not plugged in and the monitor was not getting power. All in a day of DopplerScatt deployments!
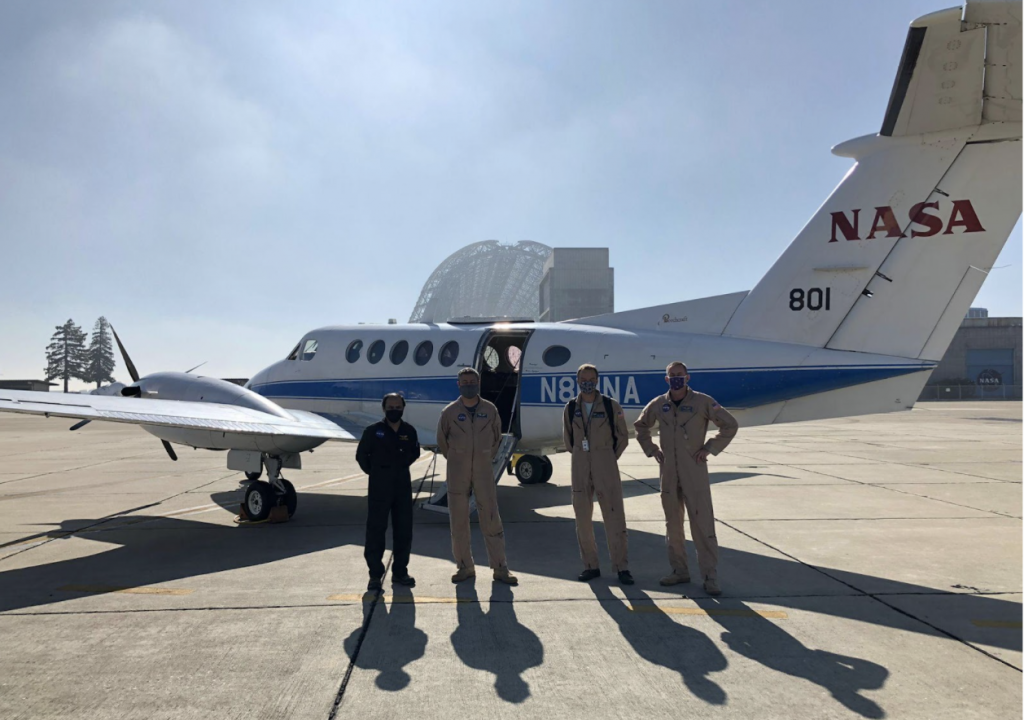
Crew in front of the NASA King Air B200.
Crew of the day from left to right: Karthik Srinivasan (JPL DopplerScatt operator), Hernan Posada (AFRC pilot), Jeroen Molemaker (UCLA MOSES operator), James Less (AFRC pilot). Photo credit: Alex Wineteer / NASA JPL

11/04/21

Today is a science extravaganza! We have a big day ahead of us with two NASA King Air B200 flights planned and all of the in-water assets sampling data throughout the day. The weather is finally cooperating and we have a clear yet windy day ahead of us. The plan today is to fly a morning flight – which just took off at 8am – and then another one leaving approximately 6 hours later and flying the exact same pattern. The comparison of data between the two will tell us about the daily variability of the ocean processes. 

“This is one of the reasons why I am so excited about S-MODE,” said Hector Torres, DopplerScatt team member, operator and one of the main people responsible for simulating ocean processes. “The results based on theory and numerical simulations produced in the last five years are about to get confirmed or debunked today. Either way it will be a breakthrough!”

Flight one is now done! There were some pesky low clouds right in the area of collection that prevented MOSES from collecting quality data for half of the flight, but the second half was great. DopplerScatt data collection went as planned and data are churning already! We are seeing the first quick look data products trickle in as we watch the afternoon flight take off.

While the first flight was a bit difficult for our optical colleague running the MOSES system, Jeroen Molemaker from the University of California, Los Angeles, the afternoon was gloriously clear and provided a great opportunity for all airborne instruments to collect data at the same time. 

Quick look composite image of the sea surface temperature as observed by the MOSES instrument on the November 4, 2021 afternoon flight. The tracks are overlaid on DopplerScatt derived surface current velocities from the morning flight, showing the spatial relationship between currents and density fields. The color scale blue to red has a range of 2°C. Credit: NASA’s S-MODE team / Jeroen Molemaker

Today the S-MODE pilot experiment operated as we envisioned many months ago, with all platforms sampling data throughout the day over the area of interest. The field experiment crew is  tired but happy and the team is excited about the science that we will extract from this data set.

Goodnight moon. NASA King Air B200 on arrival at Moffett Field, California after a long day of flights. Photo credit: Alex Wineteer / NASA Jet Propulsion Laboratory

11/05/21

Today is the final day of the S-MODE pilot campaign. It’s a bittersweet feeling for me as it was so much fun to collaborate and coordinate daily activities with so many people. I will miss that, but I certainly will not miss the hectic calls of “we have a problem with …”

The NASA King Air B200 will fly in the afternoon collecting data in the western region of the S-MODE study area  together with the Twin Otter aircraft. Meanwhile, our friends on the ship will start recovering the autonomous assets and make their way toward Newport, Oregon.

Trouble struck again as our GPS unit could not get itself aligned and produce a good navigation solution, requiring a power reset and making S-turns i.e. banking the aircraft left and right in succession. After this excitement things went smoothly for the rest of the flight. You never know what will go wrong during a field deployment, you just know that something will and you need to be prepared to react and fix things without letting the panic set in! Thankfully that is what happened today thanks to Alex Winteer, a DopplerScatt operator from NASA JPL. He performed a cool and collected power reset while in air!

Happy crew on their last flight of the S-MODE pilot campaign. On the left is Jeroen Molemaker (UCLA MOSES operator) and on the right is Alex Wineteer (JPL DopplerScatt operator). Photo credit: Karthik Srinivasan / NASA JPL

Now it is time to work on our post-deployment to do list and eagerly await results of data processing.

I will leave you with two short blurbs from DopplerScatt team members Alex and Karthik about their impressions of the pilot campaign. 

“On most days, you don’t wake up looking forward to a boring day. As an instrument operator, a boring day during a deployment, however, is a different story. You look forward to sitting in a small round aluminum tube for 4.5 hours with nothing to do. That is a perfect day – a day when the radar just works. No last minute excitement of monitors not turning on (because someone unplugged it and forgot to plug it back in!) or the satellite phone connection not working. While the entire science team is excited about an action-packed day of coincident data collection, all the instrument operators look forward to is a day where everything just works as it should! Of course, sitting in an aluminum tube for many hours, staring out at the ocean with nothing to do makes you yearn for some excitement, but that is a fleeting thought until you get a text message via satellite link asking you to pay attention to the speed of the aircraft!” 

– Karthik Srinivasan, NASA JPL DopplerScatt operator


“I’ve been on quite a few field deployments with DopplerScatt, but none quite as exciting – or as important—as this one. Indeed, such a coordinated effort consisting of multiple aircraft and many assets in the water has never been attempted, and the resulting science will lead to new understanding of our ocean, atmosphere and the climate system as a whole. On Thursday, we attempted two flights for the first time. I operated the first flight: crew brief at 6:30 AM with a takeoff time of 8 AM. Thankfully, our instrument operated normally, and we were able to fly a bit lower –under the clouds – to ensure MOSES could see the ocean surface with its infrared camera. We landed five hours later, at around 1 PM, and I immediately took our data back to our field processing center in the aircraft hangar to start crunching. In the meantime, Karthik took off for our second flight of the day. By the time I finished the first round of processing, it was 5 PM and Karthik was almost back from the second flight, so I went downstairs to welcome him back (and grab the data!). A few hours later, we had both flights processed to quick look data products and I was exhausted. Being just one person, a small part of a much larger mission, it can be easy to lose sight of why we do this, especially when the hours are long. But when the data started pouring in, my exhaustion was quickly replaced by excitement. We were seeing a dataset no one had ever seen before. With these two flights, we are able to not just see the sub-mesoscale structure of the ocean surface over a large area, but we could also see its evolution over time and how the atmosphere interacts with that evolution! There is much work to go in analyzing these data, especially in comparing the many other instruments to our DopplerScatt measurements, but I am grateful to play a part in that analysis, discovery and understanding.”

– Alex Wineteer, NASA JPL DopplerScatt operator

The (Virtual) Room Where it Happens: Inside NASA S-MODE’s Control Center

By Alison Gold // NASA GODDARD SPACE FLIGHT CENTER, MARYLAND //

NASA’s Sub-Mesoscale Ocean Dynamics Experiment (S-MODE) relies on two aircraft, 17 remote-controlled vehicles, a ship and dozens of drifting instruments to make its detailed study of ocean eddies, currents and whirlpools. The researchers aim to assess how these small, high-energy ocean events contribute to circulation and heat exchange in the upper ocean, and how oceans affect climate change. The tools are stationed in a 7,800 square mile (roughly 20,200 square km) area west of San Francisco Bay, which the researchers call the “S-MODE Polygon.”

But one of the mission’s most critical tools, its control center, is not on site. The control center is a virtual daily meeting where up to 40 scientists gather to share new data, check in on the mission’s assets and plan where to maneuver their instruments and vehicles to capture the most useful measurements.

Map of the S-MODE study area, or "S-MODE polygon",  off the coast of San Francisco.
The S-MODE Polygon, where the mission’s instruments are stationed, is located off the coast of San Francisco. Credit: Cesar Rocha / University of Connecticut

The S-MODE researchers are studying sub-mesoscale ocean processes like eddies – swirling pockets of ocean water that stretch about 6.2 miles or 10 kilometers in distance and often last for only a few days. Because eddies are relatively small and quick-fading, they can be challenging to study. Opportunities to study these processes often spring up with little warning. To study these events, the S-MODE team needs to be able to move their vehicles around quickly and strategically within the polygon.

For instance, one of the airborne instruments may spot an eddie or whirlpool developing. The scientists may then decide which water measurements they would like to gather, and agree to send the appropriate mission vehicles out to the location of interest. The scientists discuss such decisions at control center meetings.

During the call, representatives for each of the assets begin by providing their status updates.

“First, we review the data our assets are seeing in the field that day or the day before, and then decide what is the interesting feature that we want to study,” said Dragana Perkovic-Martin, principal investigator for DopplerScatt, one of S-MODE’s airborne instruments, at NASA’s Jet Propulsion Laboratory. “Based on that decision, we determine which assets we need in that spot and position them in the right area.” 

A screengrab of scientists during a virtual control center meeting.
Scientists participate in a control center meeting on October 22.

The control center was originally going to be hosted in-person at the NASA Ames Research Center in Silicon Valley, California.

“The idea was for a group of us to work together there to examine the conditions and the data and to update the plan as things unfolded,” said Tom Farrar, S-MODE Principal Investigator and a scientist at Woods Hole Oceanographic Institution in Falmouth, Massachusetts. As COVID-19 cases surged in late summer 2021, the team decided to shift to a virtual format. Now, the only people who are in the field are those who cannot complete their work remotely, like those flying the planes or collecting measurements aboard the ship.

All of the scientists involved in S-MODE have done traditional field deployments before, Perkovic-Martin said. But few have had experience coordinating an expedition from a virtual control center. The group has adapted quickly with the help of online platforms including Slack, WebEx, email, and Zoom.

“The control center works in much the same way as originally envisioned, with a group of people trying to take in as much information about what is happening to make decisions about the plan,” Farrar said. 

One of the S-MODE Deputy Principal Investigators, Professor Eric D’Asaro of the University of Washington, leads control center meetings, with the goal of ending each meeting with an updated plan for the next few days.

“We have benefitted a lot from Eric’s enthusiasm, and his experience in other large field campaigns,” Farrar said. “We have a great team of experts and specialists, and I’m really excited about the coordinated dataset the team is collecting.”


On the Edge of Something New: Studying the Sea with a Fleet of Technologies

By Nick Pizzo // OFF THE COAST OF CALIFORNIA //

The October deployment of NASA’s Sub-Mesoscale Ocean Dynamics Experiment (S-MODE) mission is underway and a current of excitement has filled the halls of our virtual meetings. Over the past two years, more than 50 members of the S-MODE project have been meeting virtually to prepare for this moment. Our campaign has begun and we are testing our instruments, optimizing our sampling patterns and comparing our measurements between various instruments over a nearly three-week pilot experiment. The mission for S-MODE is ambitious: we seek to better measure, understand and ultimately model submesoscale currents, which are ocean fronts, narrow currents called jets, and filaments that are about 300 feet (100 meters) to 6.2 miles (10 kilometers). These are elusive targets for oceanographers as they are difficult to measure: too big for a ship-based study alone, too quick for ship surveys, and too small for remote sensing. Therefore, these currents must be examined using a combination of different approaches and novel technologies, as is being done in our experiment. 

View of the R/V Oceanus ship taken from the Twin Otter aircraft.
View of R/V Oceanus from the Twin Otter aircraft with the SIO MASS package on board. Credit: Nick Statom / Scripps Institution of Oceanography

To researchers with the NASA S-MODE mission, it feels like we are near the edge of something new – that it is a time of rapid change in our understanding of the ocean. Sub-mesoscale currents pull apart and push together water at the ocean surface, and this leads to water flowing up and down, respectively. This up and down motion is important for a number of Earth science processes, including interactions of the air and sea that impact weather and processes that affect the distribution of nutrients that are important for plankton productivity. 

Autonomous vehicles called Wave Gliders on the deck of the R/V Oceanus ship.
Wave Gliders on the deck of the R/V Oceanus being prepared for deployment. Credit: Courtesy of Ben Hodges / Woods Hole Oceanographic Institution(WHOI)

I am part of a team that is deploying Wave Gliders, a small uncrewed vessel that has a set of fins on a submersible platform tethered to a surface float, which it uses to kick its way around the upper ocean. These platforms are decked out with instruments and are not limited by interference from the ship. They also do not have the same risk as putting humans out in the middle of large storms (like ones we have experienced during S-MODE!). 

On the transit from Newport, Oregon to the experiment site off the coast of San Francisco, large waves (some reaching around 23 feet or 7 meters tall) rolled over the deck of the research vessel Oceanus and three of the four Wave Gliders were damaged in the process. Researchers in the Air-Sea Interaction Laboratory at Scripps Institution of Oceanography and a team at Woods Hole Oceanographic Institution began to problem solve issues with the Wave Gliders by inspecting extra platforms that were on land here in San Diego, California and diagnosing the issues based on pictures provided by the team on the R/V Oceanus. Scientists from across the country then assembled to repair the Wave gliders in San Francisco harbor.

Scientists perform emergency repairs on the Wave Gliders.
Ben Hodges, Emerson Hasbrouck, Luc Lenain and Laurent Grare (not shown) perform emergency repairs to the Wave Gliders! Credit: Courtesy of Laurent Grare / Scripps Institute of Oceanography

With the Wave Gliders repaired and deployed, we could again pursue our mission objectives. There was still considerable swell in the water from a historically large storm that had just passed through the region (which was accompanied by the well-publicized atmospheric river that brought so much rain and snow to northern California). In fact, the Saildrones in our campaign measured large significant wave heights during this storm! After the major storms passed, the Wave Gliders were deployed, and they are currently operating in unison with the other instruments in the campaign. The data has started to roll in!

I and several others in the campaign am interested in how surface waves interact with sub-mesoscale current features. For example, as waves turn as they approach the beach to be parallel to shore, sub-mesoscale currents steer the waves, sometimes leading to wave breaking in localized regions. These breaking waves are important for upper ocean dynamics and air-sea interactions: they generate spray and bubbles that are important for gas transfer between the atmosphere and ocean.  Historically, wave data has been viewed as measurement noise. But, with the emerging technologies being employed in S-MODE, scientists are excited about the possibility that wave information can tell us about the underlying currents.


Figure showing measurements from the Sail Drones of the significant wave heights.
Measurements from the Sail Drones of the significant wave heights. Figure courtesy of Bia Villas Boas / Caltech / Colorado School of Mines

For many of us, this experiment has been invigorating, bringing us back in touch with the excitement and discovery that comes with oceanographic field campaigns. There have been many excited conversations around a monitor, examining the data as it comes into our stations on shore. As an early career scientist, I feel as if I am taking part in a historical campaign. This is truly an exciting time to be an oceanographer.  

Researchers Kayli Matsuyoshi, Luke Colosi and Luc Lenain in the Air-Sea Interaction Laboratory at SIO discussing the latest S-MODE findings.
Researchers Kayli Matsuyoshi, Luke Colosi and Luc Lenain in the Air-Sea Interaction Laboratory at SIO discussing the latest S-MODE findings. Credit: Courtesy of Nick Pizzo


Unexpected Turbulence for the S-MODE Airborne Instruments

By Dragana Perkovic-Martin, Principal Investigator for DopplerScatt at NASA’s Jet Propulsion Laboratory // SOUTHERN CALIFORNIA //

Flight crew for October 25, 2021. From left to right: Delphine Hypolite (UCLA MOSES operator), Michael Stewart (Ames Research Center pilot), Tracy Phelps (Armstrong Flight Research Center – Armstrong Flight Research Center pilot) and Federica Polverari (JPL DopplerScatt operator). Photo credit: Hector Torres Guiterrez / NASA JPL

10/25/2021

The first message I read this morning is that Ernesto, one of the deputy Principal Investigators on the S-MODE project and our project scientist for DopplerScatt, has succumbed to food poisoning. So, I am going to be making all of the decisions today. I guess I am ready…

We proceeded with our DopplerScatt morning meeting and made some tentative decisions about the flights this week and then went to the flight briefing to stress the importance of flight tracks today and what to nix in case of low fuel. As I was updating the S-MODE control center briefing package about the week’s forecast, Ernesto came back into play. One thing I can say is that we anticipated very well in the decisions we made in the early morning, so I guess I know how to impersonate!

Today’s flight plan focuses on the same area of the S-MODE polygon as last week – the  north-western boundary where the cold filament is collapsing under the warm water.

Underlying VIIRS sea surface temperature from Monday October 25th overlaid by NASA King Air B200 tracks in pink, Twin Otter tracks in black, and Saildrone region of operation (green and yellow rectangles). Red is warm water, green and blue are cooler water.
Credit: NASA S-MODE with Google Earth imagery

The flight is another combination of the King Air B200 and Twin Otter, with the Saildrones down below. All of our assets are active at this time! The first reports from the King Air B200 show the weather is favorable for another excellent day of data collection. 

But…  we had an unexpected power shutdown on board the aircraft for all instruments. While the power was restored immediately and the MOSES camera came back online quite quickly, the DopplerScatt instrument was slow to get out of bed. Typically, the instrument is powered before takeoff and we only enable radar signal transmission through the antenna once we are at safe altitude, which takes seconds. After about 20 minutes DopplerScatt was restored to its previous state and continued to collect data. We were thrilled on the ground and up in the air! Alas, that was not the end of our troubles… 

DopplerScatt requires precise knowledge of its position and orientation so that its radar data that it collects can be processed on board and on the ground. These data are what we call navigation data and they come from a Global Positioning System/Inertial Motion Unit (basically a GPS) instrument aboard the DopplerScatt instrument. After the power on, DopplerScatt was unable to process data onboard. Post landing data were transferred to a ground server where they will be evaluated for usability. 

Looking at the glass half full, the King Air B200 completed all of its planned flight tracks, and MOSES recovered from the power down and collected data almost uninterrupted. DopplerScatt at most lost 25% of its collection – which is not too shabby. We are hoping the planned flight for tomorrow will be less eventful than the one we had today. We like excitement, but not of this kind.

Hector Torres (JPL DopplerScatt operator) ready for the flight on October 26. Photo credit: Federica Polverari / NASA JPL

10/26/21

We are back at it and preparing for the new flight. Today’s plan was for DopplerScatt to survey a wider area to try and see which new feature the S-MODE experiment should focus on. After lots of discussion of how to manage a sudden shutdown onboard, Hector Torres is back at the DopplerScatt “driver seat” – this time on his own with the pilots because the weather is poor for optical measurements, so we decided not to use MOSES today.

DopplerScatt was reported as good to go and the aircraft took off. The next message was something that none really wanted to receive…. The aircraft was reporting a bleed air flow – essentially reporting that they would have pressurization issues. Rather serious stuff. We anxiously watched the aircraft descend and come back to Moffett Field, thankfully landing safely and Hector reported all was well with him and instrument. 

The next day we are in much better shape than yesterday! The aircraft has been repaired and is ready to go for the next flight. We have also recovered the navigation data from the flight on October 25, so now we know that we will be able to process all of the radar data from this flight. 

10/28/2021

Federica Polverari (JPL DopplerScatt operator) waiting to board the NASA B200 King Air prior to flight on October 28th. Photo credit: Hector Torres Guieterrez / NASA JPL

At 1pm today we’re cleared for takeoff. Today’s data collection is at full strength, with all S-MODE assets collecting data. This is the first time during the campaign that we’re using all of the assets at once, so it is a big day. Of course – we are just learning how difficult it is to forecast fog…. While DopplerScatt and our in-water assets are fine, our optical remote sensing instruments MASS and MOSES are having a hard time today trying to find a place with good visibility. 

While the fog did create issues for the MOSES camera, DopplerScatt had a stellar day! The flight was centered on the new area of the S-MODE study area and we collected some very exciting data. DopplerScatt seems to have captured a cold front of water where we expected, but we need to upload the data into our computer to process it before we can tell if what we’re seeing is real, or if the DopplerScatt team has an overly active imagination.

Here is the happy crew and a few additional folks who joined the post-flight festivities!

Federica Polverari taking a selfie with the NASA B200 King Air crew for the day. From left to right: Jeff Borton (AFRC pilot), Alex Wineteer (JPL DopplerScatt operator and winds processing guru), Delphine Hypolite (UCLA MOSES operator), Tracy Phelps (AFRC pilot), Hector Torres (JPL DopplerScatt operator), Sommer Nichols (ARC Deputy Project Manager). Photo credit: Federica Polverari / NASA JPL

10/29/21

Talk about last minute changes….. Folks aboard the Twin Otter aircraft reported that they found an area with no fog, however that area was the one that the B200 King Air would visit last in today’s flight. If we wait  too long then the area may get covered by fog and clouds and MOSES would not be able to see through them. Thanks to our newly-installed satellite communication link on the B200 King Air, we messaged the pilots and asked that they change the order of the flight tracks today. Just after takeoff they confirmed this would be possible, and the science team went wild. The images we received from the flight tell us that we were correct to change this order – so phew! We are now glued to our screens following the flights as well as in-water measurements. Today we have the full set of gizmos in the field!

Delphine Hypolite (UCLA MOSES operator) and Karthik Srinivasan (JPL DopplerScatt operator) in flight on October 29. Photo credit: Karthik Srinivasan / NASA JPL

While flight planning and execution was very dynamic and fun, there was another great accomplishment today. We produced our “quick look” data images overnight! What we call quick look images are data products that we crunch as soon as possible after the flight, using the on-board processed data as a starting point. These results have not been through the full calibration and quality check rigor that we usually apply, so they are preliminary. However, they are very important so that the team gets an idea of what is happening, and the products are used for planning activities the next day. 

DopplerScatt preliminary “quick look” results for the October 28, 2021 data collection show estimated wind vectors over the study area. This wind field shows the wind stress is affected by the thermal feedback of the sea surface front shown by VIIRS, where winds slow down as they move across cooler water. Wind stress is also affected by kinematic feedback from the underlying surface currents. The near-instantaneous response of these scatterometer measured winds to the ocean implies a much stronger coupling between atmosphere and ocean than has previously been observed by lower resolution measurements. Credit: NASA S-MODE with imagery from Google Earth
DopplerScatt preliminary “quick look” results for October 28, 2021 showing estimated surface current vectors over the study area. A complex circulation established by the cold front was observed by DopplerScatt: southward flow in the north-western part, eastward flow in the eastern part, and zones of convergence in the center. Credit: NASA S-MODE with imagery from Google Earth

10/30/21

The hinge between the monitor and keyboard failed us today. Nothing that cannot be fixed, thankfully. It just seems that we need to give our DopplerScatt instrument some TLC when we are back in our lab. 

Today was another super successful collection at full S-MODE strength. The research vessel, Oceanus, made planned measurements while the Wave Gliders and Saildrones fought the currents and winds to make transects through the area of interest. The Twin Otter aircraft flew in concert with the B200 King Air and collected data spaced very close in time with DopplerScatt. The MOSES instrument managed some measurements in gaps between the clouds and fog. But the highlights of the day were the quick look products from DopplerScatt within an hour and a half from the collection – all hail our data processing gurus Alex and Ernesto!

10/31/2021

While many were out trick-or-treating for Hallowen, the B200 King Air gave us several tricks. Several issues sprung up, however, due to some rather swift actions of the ground crew the takeoff delay amounted to only a half hour. DopplerScatt collected data at the same time as the Twin Otter flights and MASS instrument collections, so we have lots of intercomparisons to look forward to. 

Tomorrow is a down day for the crew to rest. There will be no flight so we can ensure that we can fly every day for the rest of the campaign.

NASA B200 King Air ground and air crew from left to right: Sam Habbal (AFRC ground crew), Karthik Srinivasan (JPL DopplerScatt operator), Alex Wineteer (JPL DopplerScatt operator), Tracy Phelps (AFRC pilot), Delphine Hypolite (UCLA MOSES operator), David Carbajal (AFRC ground crew), Leroy Marsh (AFRC Inspector) and Tom Lynn (ARC ground crew). Photo credit: Erin Czech / NASA Ames Research Center