By Audrey Delpech, postdoc in the Atmospheric and Oceanic Sciences department at UCLA
Being part of the NASA S-MODE oceanographic mission was a great experience for me. It was only my second oceanographic mission and my first one on a US research vessel. I learned a lot about how to use the different instruments, interpret their data and about the complexity of the ocean.
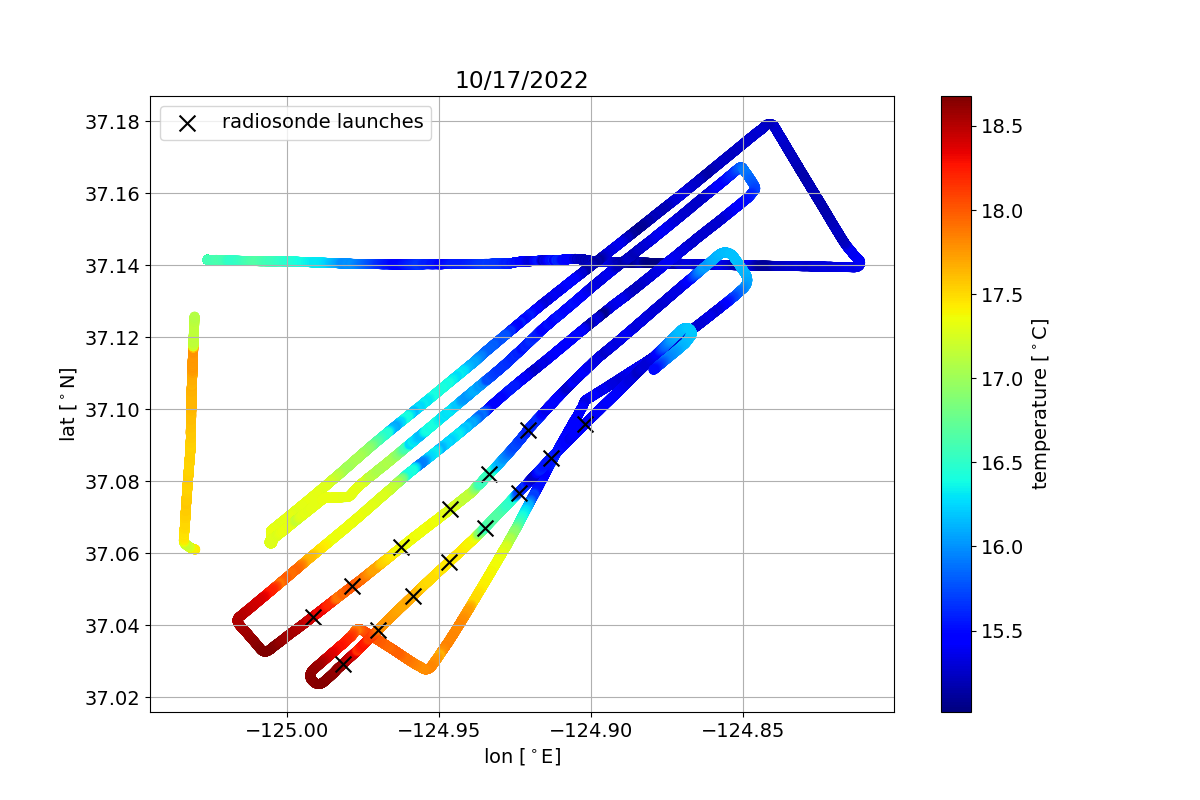
This mission is designed to study submesoscale fronts – which correspond to abrupt changes of water temperature or salinity over scales of about 6 miles or 10 kilometers in the ocean. They act in a similar way as we have fronts in the atmosphere that bring us cold or warm weather, rain or dry air masses. S-MODE is making the first observations that show such fronts do play a role in stabilizing our climate by acting as a connector between the deep ocean and the atmosphere, and controlling the exchanges of quantities such as heat or carbon.
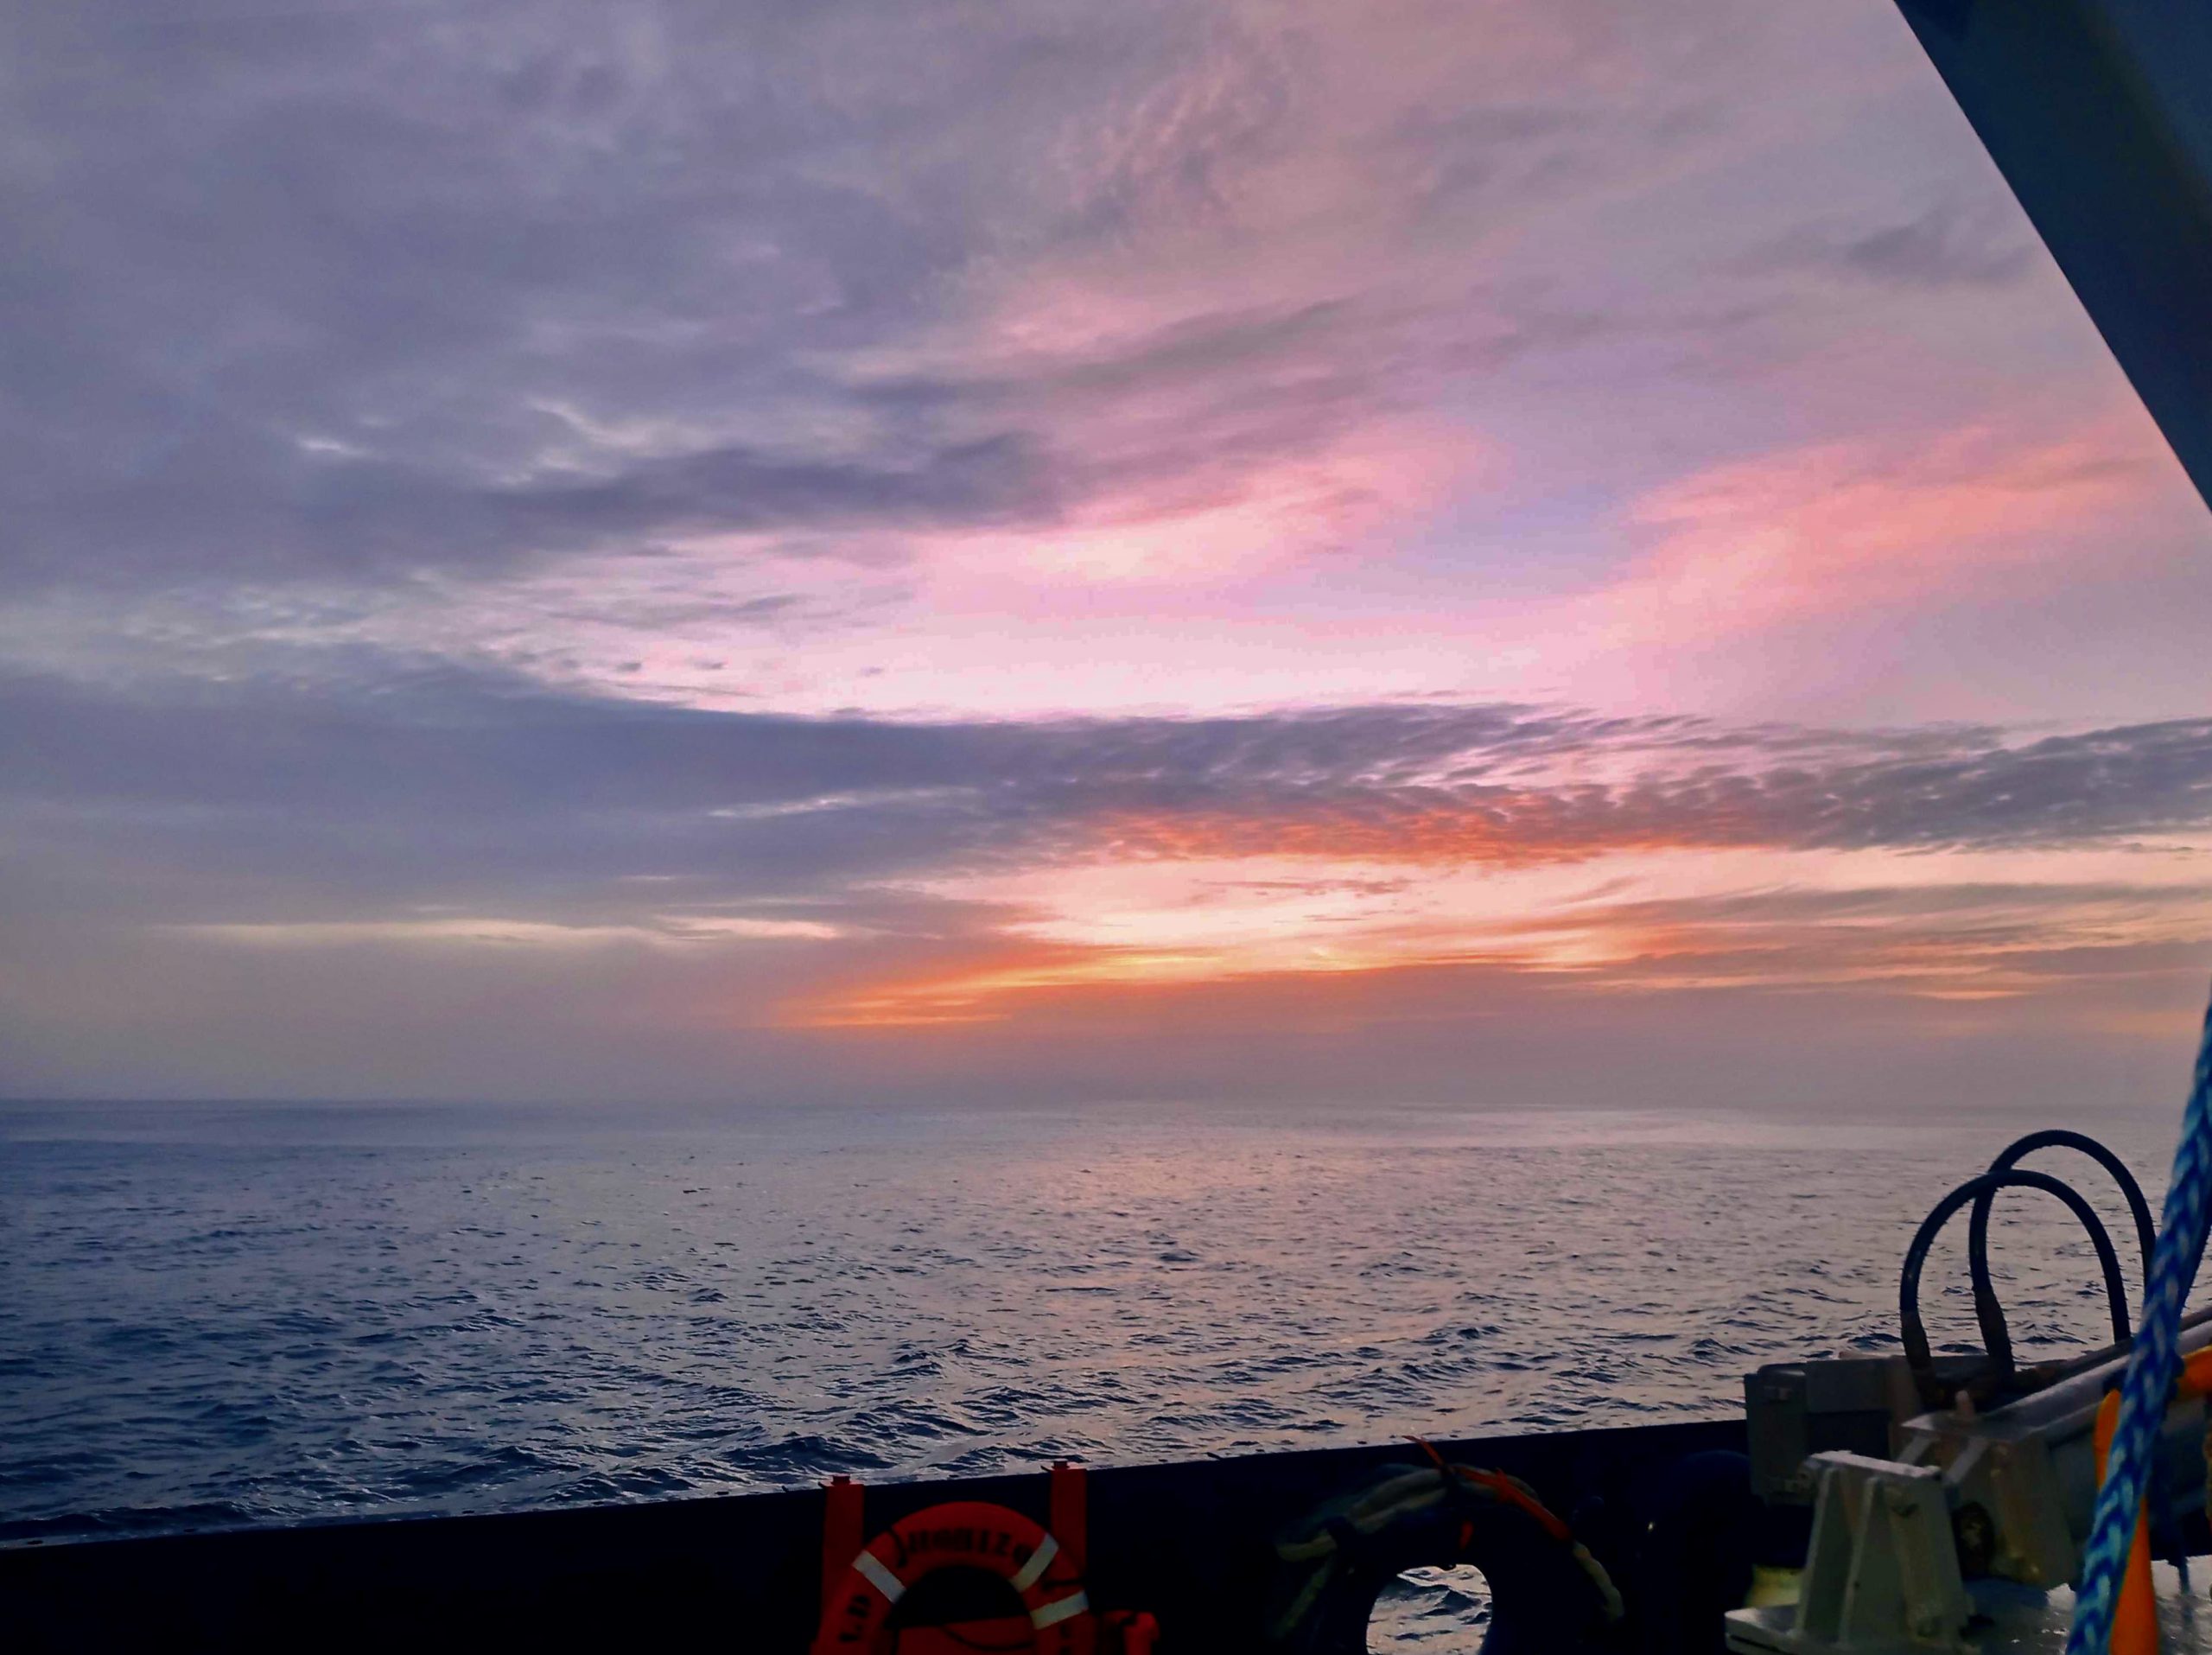
Credit: Audrey Delpech.
Because these fronts move and change throughout the day, we didn’t have a set sampling plan. Instead, we would look at the real-time conditions so we could figure out where to go and how to get the best measurements from the ship and three aircrafts. This is called “adaptative sampling.”
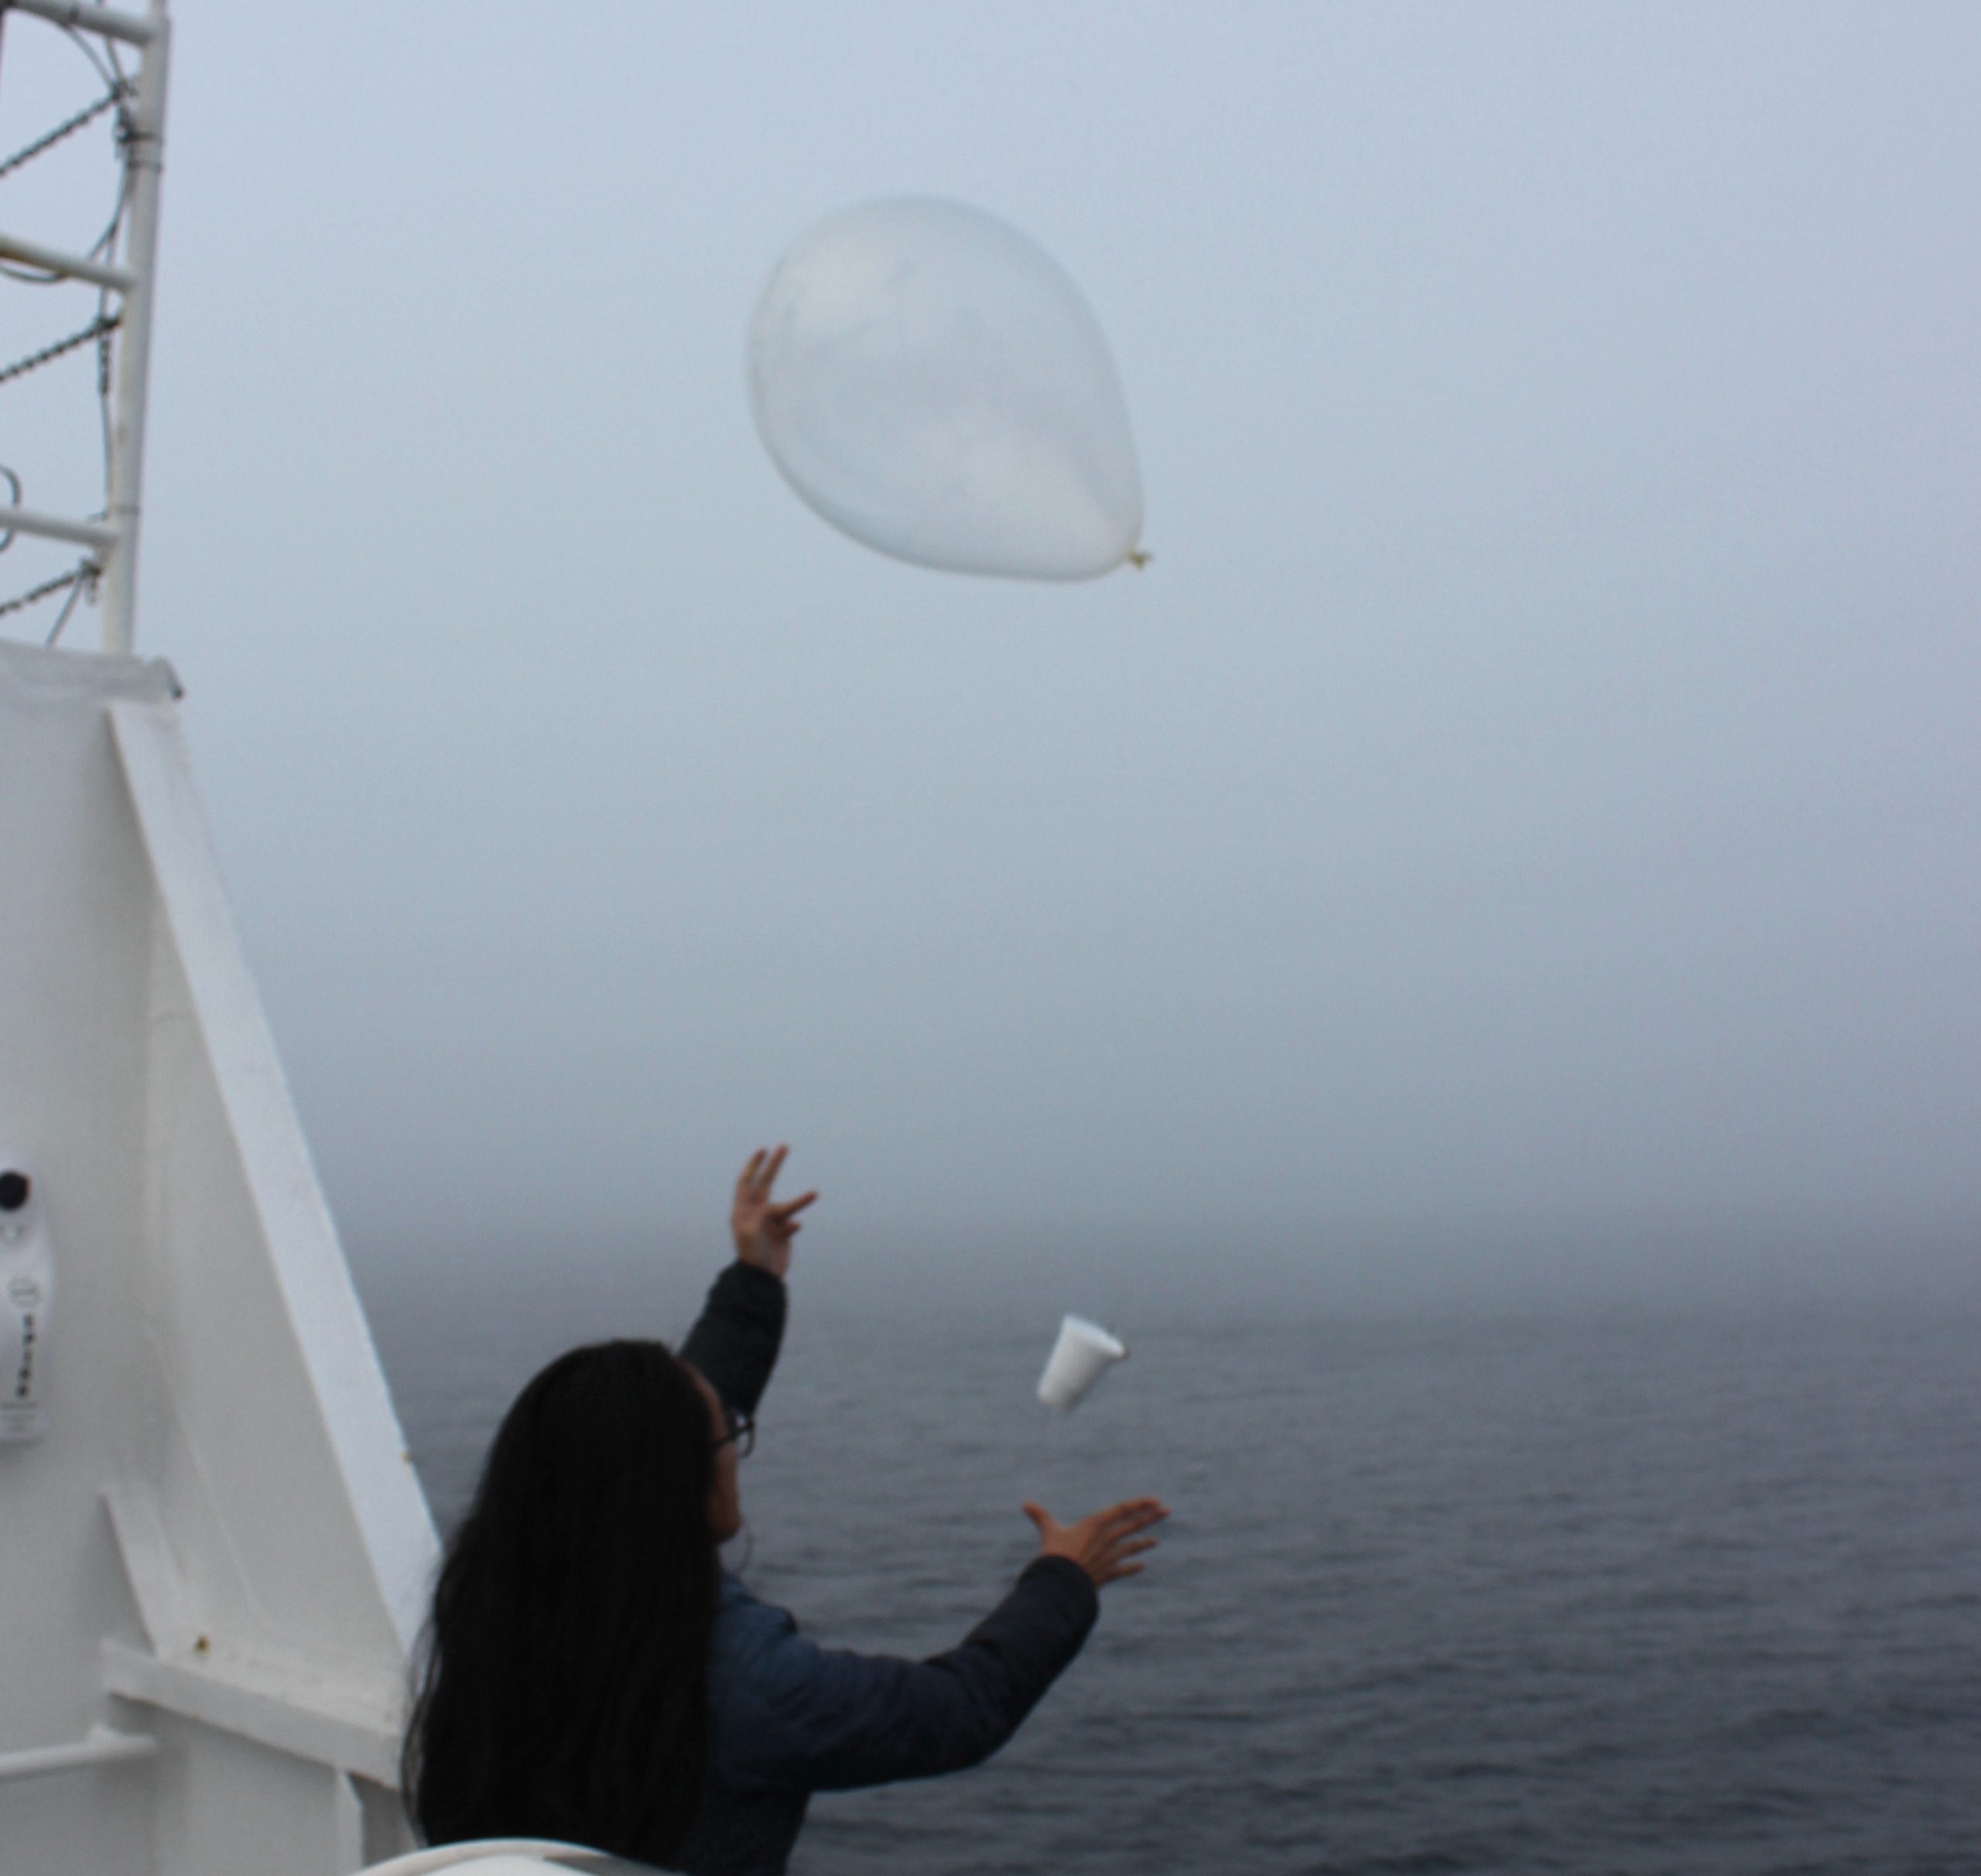
My research has lately evolved towards understanding how the ocean interacts with the atmosphere above. I have been working with models to simulate and study how submesoscale ocean motions interact and exchange energy with the winds. Onboard the ship I worked with an instrument called a radiosonde. Radiosondes are sensors which are attached to a balloon and measure temperature, humidity, wind speed and direction as they rise up in the air. I’m interested in seeing how the temperature of the ocean across these fronts influences the wind speed of the air above. We released radiosondes at regular time intervals as the ship was moving across fronts. These measurements will hopefully confirm the findings from the numerical models, and I am really looking forward to analyze them.
Another important part of my work onboard was to provide real-time weather conditions from the ship. The onshore team used my reports every day to make the decision of whether to fly the aircraft or not, or if they needed to adapt their survey region. Some airborne instruments required clear-sky conditions or high enough clouds so they could fly in the clear underneath. The radiosondes measurements helped me figure out how high and how thick the clouds were, two important parameters to characterize the cloud coverage.
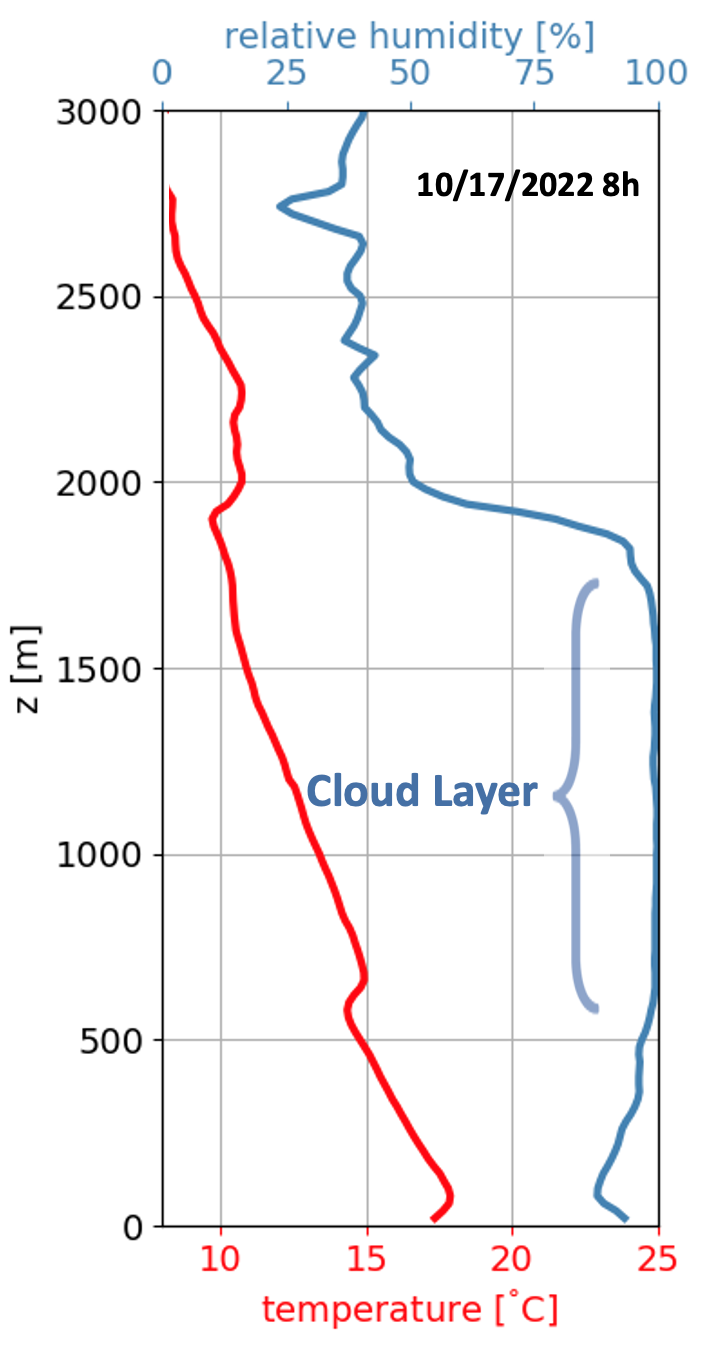
I also collected radiosondes’ atmospheric temperature and humidity profiles from the sea surface to about 8 km height at the same time the airplanes were flying overhead. These data will help calibrate the airborne infrared remote sensors.
Besides the weather reports, I also took part in many other operations. One was helping to deploy an instrument called a CTD (for Conductivity, Temperature and Depth). This instrument measures the temperature and salinity of the sweater as a function of depth as the ship is moving across the ocean. This helped us understand the vertical extension of the front in the subsurface ocean (from 0 to about 200m deep). I also helped filter water samples for future onshore DNA analyses, which will give a sense of the diversity of microscopic phytoplankton across submesoscale fronts, deployed and recovered Lagrangian floats, which are designed to drift with currents, helped navigate the ship to chase fronts, and helped with the real-time processing of data.

This experience has taught me a lot about the challenges of “adaptative sampling” and made me think differently about the value of the data collected. I now know the amount of coordination and labor that are behind them.
It was also a wonderful human experience. The community of people we were forming on this cruise was very diverse, with everyone coming from a different horizon. Several nationalities were represented and each person I met has brightened up my experience at sea. I have made some really good friends and met wonderful scientists I am looking forward to collaborate with in the future.