Refining How We See Aerosols, Clouds, and Precipitation in Climate’s Big Picture

By Andrew Dzambo / SÃO TOMÉ AND PRÍNCIPE /

Andrew is a PhD student at the University of Wisconsin-Madison.

Crew and scientists preparing for the October 2, 2018 research flight aboard the NASA P-3 aircraft. Pictured: Amie Dobracki, University of Miami. Photo Credit: Andrew Dzambo

Climate models are essential tools to predict climate’s evolution in the next few decades and beyond. Given current computational capabilities, most global models cannot resolve every scale and process; therefore, we often parameterize (i.e. simplify) the mathematical representation of the processes to obtain results in a reasonable amount of time.

Cloud processes are among the most difficult to parameterize for a number of reasons: clouds form on many different spatial scales, have highly variable time scales, and require simultaneous knowledge of a large number of factors that affect their evolution. Precipitation processes are even harder to capture in climate models because they occur on more highly variable spatial and time scales.

Additionally, the presence of aerosols, such as smoke or dust, further complicates the problem because aerosols’ effects on cloud and precipitation processes often depends on the type and amount of aerosol present.  Overall, our knowledge of how aerosols interact with clouds and precipitation is highly uncertain, especially over remote areas like the ocean. In order to better understand these processes and their impacts on the global radiation and energy budgets – essentially, how heat moves around our planet – we require highly accurate measurements of these aerosol and cloud interactions.

Group picture of some of the science crew from the transit between Sal, Cabo Verde to Sao Tome: Andrew Dzambo (front), Amie Dobracki (middle-left), Art Sedlacek (middle-right), David Harper (back-top), Sam LeBlanc (back-middle), and Tony Cook (back-bottom). Photo Credit: Andrew Dzambo
Group picture of some of the science crew aboard NASA’s P-3 research aircraft from the transit between Sal, Cabo Verde to Sao Tome: Andrew Dzambo (front), Amie Dobracki (middle-left), Art Sedlacek (middle-right), David Harper (back-top), Sam LeBlanc (back-middle), and Tony Cook (back-bottom). Photo Credit: Andrew Dzambo

NASA’s Observations of Aerosols above Clouds and their Interactions, or ORACLES, field campaign has set out to do just that. We are collecting a highly thorough, robust dataset aimed at challenging our current theories about cloud/aerosol interactions and how aerosols affect cloud and precipitation processes in stratocumulus clouds. These clouds might not be as visually stunning as ones associated with severe weather, but to atmospheric scientists, they are very important because they cover a large fraction of Earth’s subtropical oceans and have a large impact on earth’s energy budget. The ORACLES campaign, taking place over the Southeast Atlantic Ocean, bridges an observational data gap where ground and airborne observations are presently limited.

On the October 3, 2018 research flight, the biomass-burning (aerosol) layer is seen just above the stratocumulus cloud deck. Photo Credit: Andrew Dzambo

Weather radars were first developed during World War II, and radar technology has since expanded considerably. In the United States, WSR-88D radars are capable of observing (nearly) the entire country and are capable of notifying meteorologists of impending rain, snow, or destructive storms. But these radars are designed primarily to detect rainfall or ice particles larger than a small drizzle droplet. However, stratocumulus clouds are made up of even tinier cloud droplets, so the weather radar is not the best observing tool for them. Instead we need a radar system specifically designed for cloud detection.

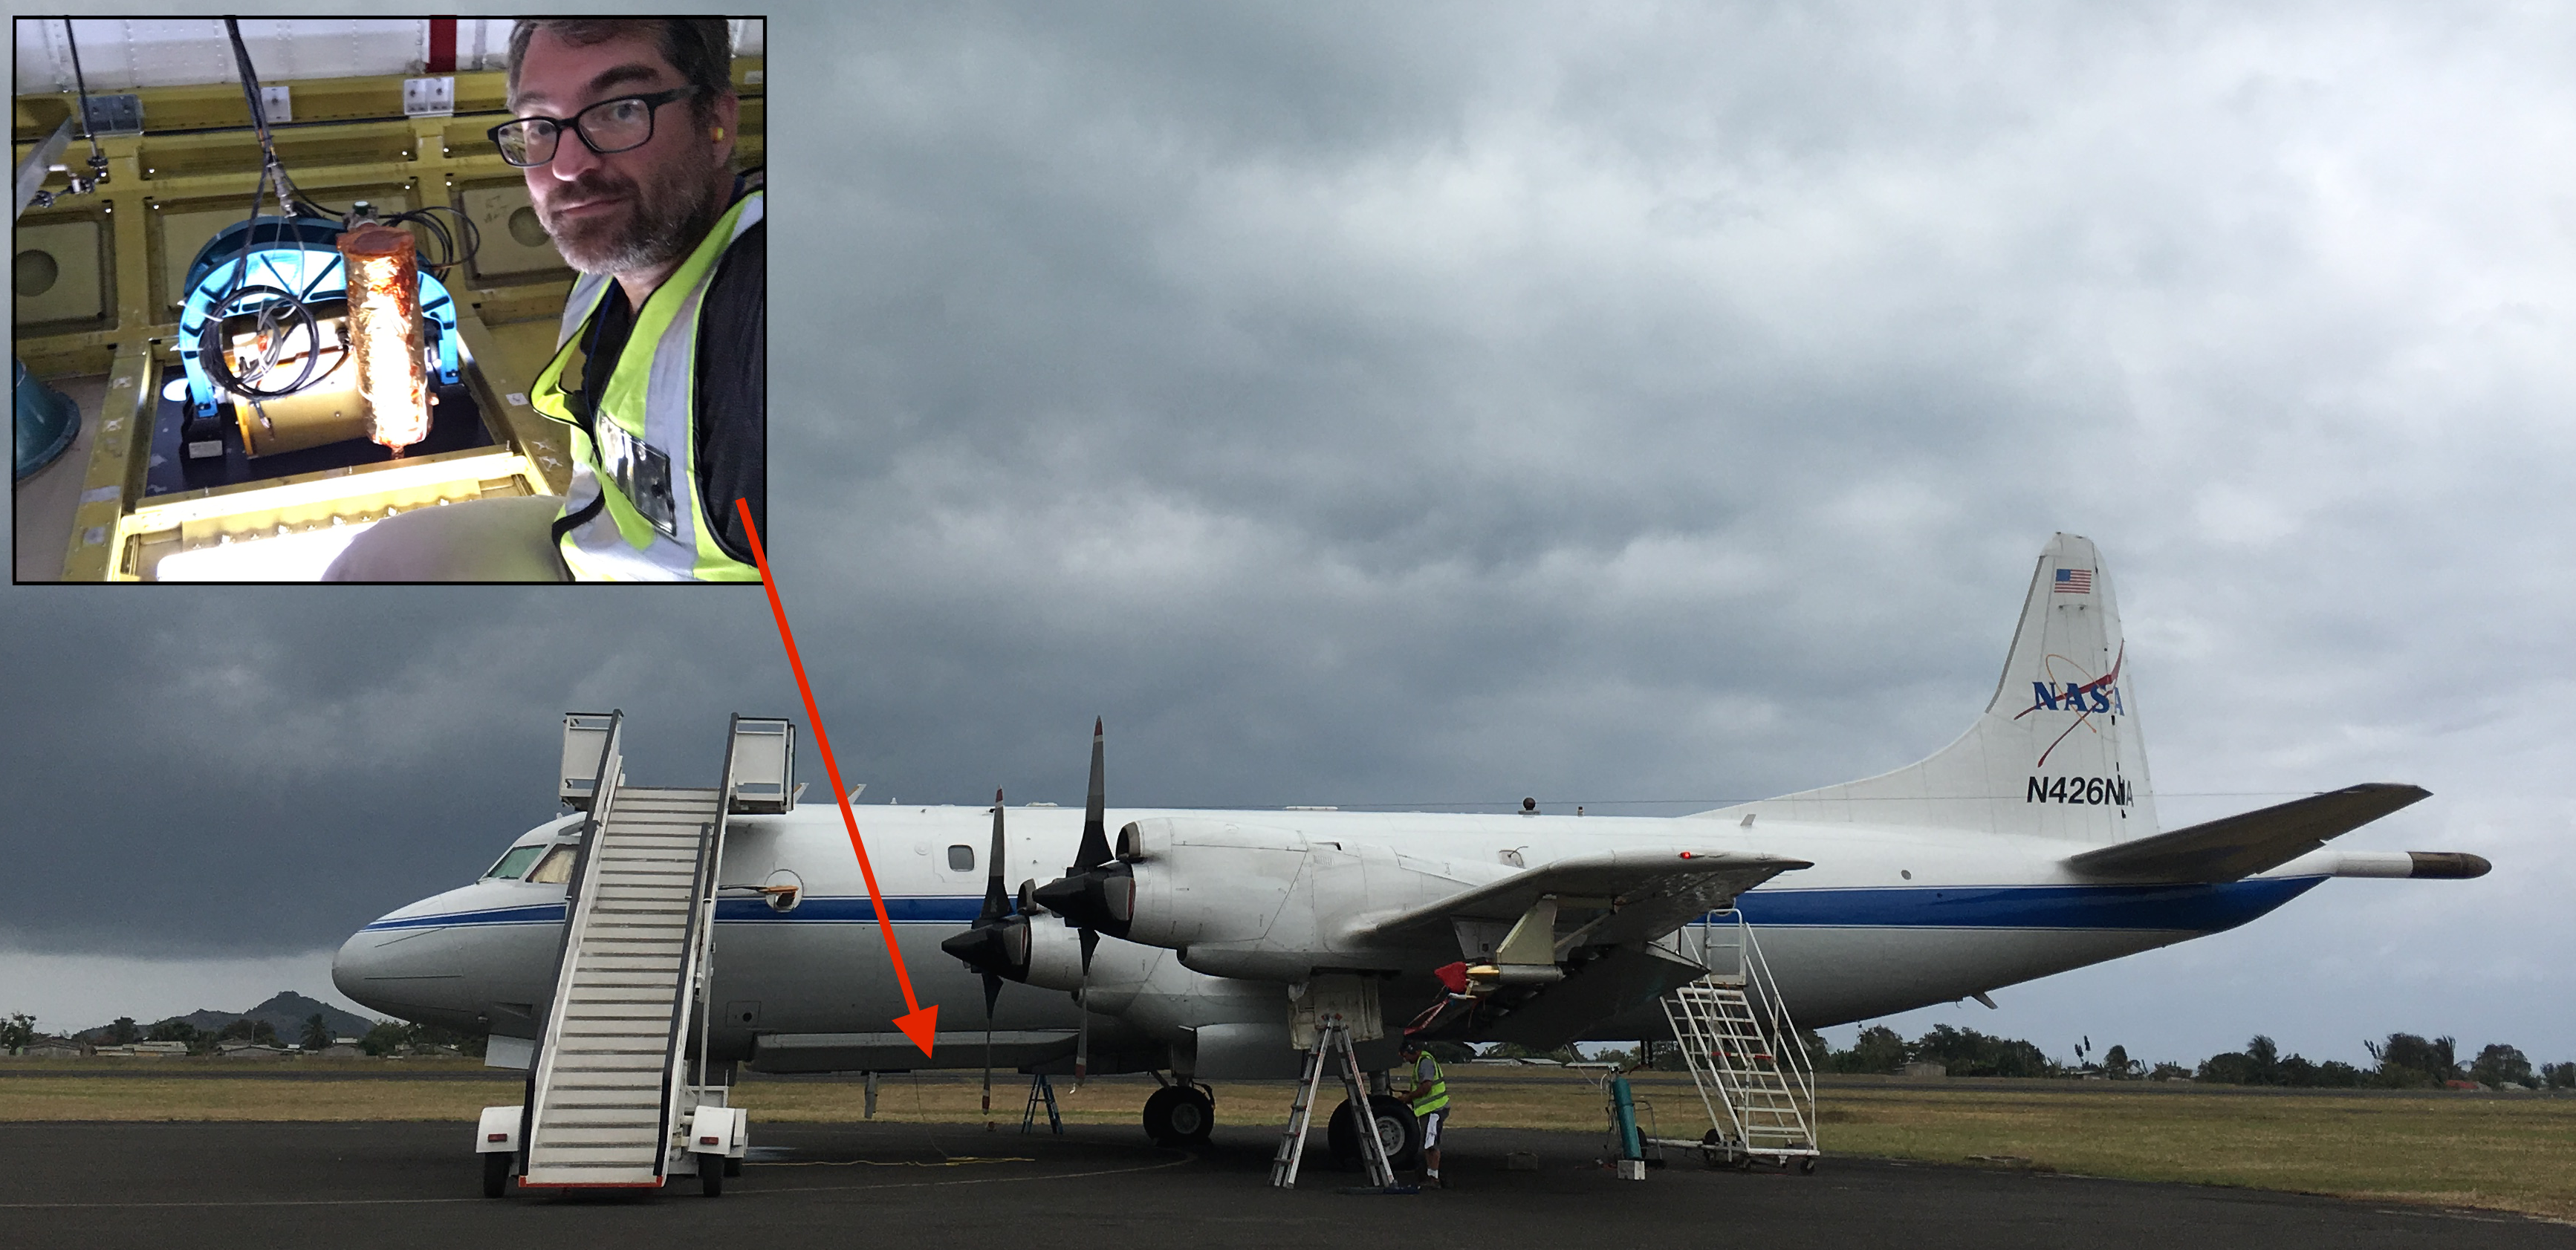
Enter the NASA Jet Propulsion Laboratory’s 3rd generation Airborne Precipitation Radar (APR-3). With development beginning back in 2002, this radar system operates at three frequency bands used to measure thin clouds and light precipitation (W-band), light to moderate precipitation (Ka-band) and moderate to heavy precipitation (Ku-band). This is the first airborne radar system capable of measuring the atmosphere at three frequencies for the same location, which means it can simultaneously detect clouds and precipitation.

During the ORACLES campaigns from 2016 through 2018, the stratocumulus cloud decks we see most often frequently go undetected by the lower frequency Ku and Ka channels. But by including the high frequency W-band radar we can now see the stratocumulus cloud and characterize its structure at a very high resolution.

Simone Tanelli (Jet Propulsion Laboratory) operating the APR-3 radar. Photo Credit: Andrew Dzambo

Occasionally, the APR-3 system in ORACLES measures both the cloud and precipitation. Detecting precipitation in multiple radar frequencies is useful as the high frequency W-band measurements commonly attenuates when precipitation gets too heavy – meaning the signal is somewhat lost because precipitating raindrops are too large. On the other hand, the other radar bands (usually Ka-band for ORACLES) can see this precipitation with little to no fading of the signal. The end result is that the multiple channels gives us the ability to better characterize the precipitation that’s happening. In turn, that gives us an opportunity to possibly provide a more accurate estimate of precipitation magnitude in these stratocumulus regions.

This is an example of both precipitating and non-precipitating stratocumulus as seen by the APR-3 radar. The highly sensitive cloud radar (W band, bottom) sees both the clouds and precipitation, whereas the Ka (middle) sees only precipitation and the Ku band (top) sees only the heaviest precipitation. Yellows, oranges and reds indicate precipitation, and blues/greens indicate clouds. The white bar at 0 kilometer/kilofeet (1000 feet) altitude shows the surface. Image Credit: Andrew Dzambo

The ORACLES APR-3 contributes one component of a highly robust dataset designed to study the effects of aerosols on cloud and precipitation processes. Other direct and remote sensing instruments from the ORACLES field campaign collect highly detailed information about aerosol type and amount in the atmosphere – both of which are needed to properly assess cloud/aerosol interactions and their net effect on precipitation. Ultimately, ORACLES will greatly improve how we describe aerosol/cloud/precipitation interactions in future climate models.

Making It Work in the Field with ORACLES

Visible haze layer above and around some small cumulus clouds, as seen from the window of NASA’s Orion P-3 aircraft. Credit: NASA/Kristina Pistone

by Kristina Pistone / NASA Ames Research Center /

I’m not gonna lie: field work is probably my favorite part of the job as a scientist. Aside from my personal interest in visiting new places and cultures, having firsthand experience in data collection is valuable for when we return home and start doing the hard work of interpreting our observations to understand new things about Earth’s climate. While it’s often physically and mentally exhausting, being in the field provides a context that is difficult to get even from the most thorough notes by colleagues.

Thus, I was very excited to be able to participate in the ORACLES-2017 deployment in São Tomé, a tiny island in the crook of Africa’s arm, where we flew NASA’s Orion P-3 aircraft to understand how pollution affects clouds in this region. My colleagues Kirk Knobelspiesse and Michael Diamond have already posted a couple of great pieces, which include an overview of ORACLES, the general science questions we are studying, and how we go about doing that in the middle of the Atlantic Ocean.

I work primarily with 4STAR, the Spectrometer for Sky-Scanning, Sun-Tracking Atmospheric Research, a pretty cool instrument which we use to learn about pollution in the atmosphere. (See a more detailed post about the instrument here.) For 4STAR, deployment involves not only having an operator on every flight to make sure the instrument is in the right mode at the right time, but also cleaning and calibrating it before and after each flight to make sure everything is going as expected and that we’re able to process and interpret the data when we get home.

The Spectrometer for Sky-Scanning, Sun-Tracking Atmospheric Research, or 4STAR, down inside the plane, with its lamp attached during a post-flight cleaning and calibration. During flight, only the black spherical part is outside of the aircraft. Credit: NASA/Kristina Pistone
4STAR installed in the roof of the plane. Yes, it goes through a hole in the plane, but the hole (or lack thereof) is inspected and secured by the crew before each flight. Credit: NASA/Kristina Pistone
4STAR tracking the sun pre-flight, on a rare sunny morning! (Most days were overcast in São Tomé). 4STAR is able to find the location of the sun and adjust itself in real time to always stare at it, which allows us to get measurements even as the plane does complicated maneuvers. Credit: NASA/Kristina Pistone

Of course, despite months and even years of planning and organization, sometimes field work doesn’t go quite as expected. It’s a huge feat to pull off a massive, international, multi-institutional observing campaign, especially when it’s happening on the other side of the world and in a country where the infrastructure, where it even exists, is less well-maintained than we’re used to in the United States. Even with an excellent logistics team (which we had) things can still go wrong: shipments are delayed, the weather doesn’t cooperate, hardware suddenly fails for no apparent reason and then, right as you’ve fixed it, something different breaks. Part of the job is to make things work in the face of unexpected challenges. ORACLES-2017 was no exception. While we’ll be processing and analyzing the data we collected for months to come, there were some notable ordeals.

When I arrived in the second half to relieve my colleagues, the team had already had to deal with several mechanical issues that, while minor, meant that in the name of safety we couldn’t fly on the schedule that was initially planned. The team had to develop a new flight schedule on the fly, so to speak, while still taking into account how the atmospheric conditions changed from day to day so that each flight maximized the amount of data toward our science goals.

Daily morning forecast briefing at the airport. This may have been the day when the power went out for about three hours, but our logistics crew was able to use a backup generator to get us back on the internet so we were still able to communicate with the scientists who were out on the day’s science flight. Credit: NASA/Kristina Pistone

Instruments break. When the aerosol mass spectrometer’s (AMS) instrument power supply died with three flights still remaining, we were able to get the system working again by opening 4STAR’s spare computer and donating its power supply to the other instrument team (known as HiGEAR, since they’re from the University of Hawaii and scientists love acronyms). It ended up being functional if inelegant, due to the slightly different sizes of the two computers.

Not the clearest photo of the AMS, but as you can imagine, the blue tape is not usually present. You can just see how the replacement power supply sticks out the top, too. But it worked! Credit: NASA/Kristina Pistone

On one of our non-flying days we walked to the equator, which ran south of where we were staying (a change from flight days, when we would fly over it on our way to sample clouds). A couple of locals ended up walking along with us and between their limited English and my broken Spanish-inspired Portuguese and a lot of gesturing towards the ORACLES logo on other team members’ t-shirts, I tried to explain what exactly we were doing in their country: why we’re measuring pollution and clouds, why particularly São Tomé is the place we chose to come to measure these conditions, and how understanding the conditions of ORACLES is important to our broader understanding of Earth’s climate.

I’m not sure I got all the way through those points, but I hope it was at least partially intelligible, as part of our job as scientists is to convey to non-scientists why what we do is important. And having conversations with people who otherwise might not be exposed to Earth science is particularly important to me since we all live on the same planet, and as recent events have sadly reminded us, what goes on in Earth’s climate system often has very immediate impacts on people’s lives.

At the equator marker, with one foot in either hemisphere. Credit: NASA

One final note: a lot of us scientists, despite being Earth scientists, were super bummed to miss out on the North American eclipse last month. I think it led to a couple hours of computer screens looking like this:

Credit: NASA

But did you know that São Tomé and Príncipe played a role in another scientific eclipse event? It was one of the locations to which scientists traveled in 1919 to make observations during a different total solar eclipse that would then be used to verify Einstein’s theory of general relativity. It’s amazing to think that a hundred years ago there were scientists who probably had to overcome their own field work challenges very near to the places we were staying. Just another reminder of how global an endeavor this thing we call science is.

Up in Smoke (and Clouds) over the Southeast Atlantic

Smoke from small-scale burning on the northern side of São Tomé island. Although burning was prevalent across São Tomé, the vast majority of the smoke in our study area originated from the south-central African continent, in countries like Angola and the Democratic Republic of the Congo. Credit: Michael Diamond

by Michael Diamond / SÃO TOMÉ & PRÍNCIPE /

In August, dozens of scientists from across the United States descended on the small island nation of São Tomé and Príncipe. Nestled on the equator off the coast of western central Africa, São Tomé was an ideal location to study the phenomenon we had all gathered to observe: a seasonal plume of smoke from agricultural and forest fires that gets lofted by the prevailing winds from the African continent to over the southeast Atlantic Ocean. As part of the NASA field campaign Observations of Aerosols above Clouds and their Interactions, or ORACLES, our aim was to better understand how all that smoke over the ocean affects the amount of sunlight that gets absorbed in the atmosphere and at Earth’s surface.

Aerosols—small airborne particles, like smoke, desert dust, and sulfates from power plants—affect the amount of energy the southeastern Atlantic Ocean gets from the sun, not only by absorbing and reflecting sunlight directly, but also through its effects on clouds. A large expanse of very bright low clouds covers much of the southeastern Atlantic, very similar to the clouds off the coast of California that create San Francisco’s characteristic fog. Smoke can change the properties of these clouds in various ways, including brightening the clouds by creating lots of small droplets, which, interestingly, make the clouds less likely to drizzle and thus stick around for a longer time. Both of those changes allow the clouds to reflect more sunlight, creating a cooling effect.

As anyone who’s been outside on an overcast day knows, clouds play a major role in regulating the amount of the sun’s energy that gets to Earth’s surface, so any changes in the clouds over the southeast Atlantic and those like them across the globe can have big implications for Earth’s energy balance. It is well-known that the heat-trapping effect of man-made greenhouse gas emissions have led to a net warming over the 20th and early 21st centuries. However, unresolved scientific questions about the potential cooling effects of aerosol-cloud interactions over the past century represent a large fraction of the uncertainty in estimates of how much humans have affected the present-day climate.

Snapshot of the smoke-cloud system over the southeast Atlantic Ocean, taken from the window of the P-3 during the August 24th routine flight. A thick plume of milky-gray smoke overlies a blue ocean surface dotted with puffy white low clouds. Credit: Michael Diamond

For ORACLES, NASA’s P-3 Orion aircraft was our primary transport for measuring the smoke-cloud system. On the P-3 we have a set of instruments that can be broadly separated into two categories: in-situ and remote sensing.

In-situ instruments, like those in the picture collage below, measure things in place through air inlets. For example, we have particle counters that can measure the number and size of smoke particles in a plume, and cloud probes that can measure how much liquid water is in a cloud.

In contrast, remote sensing instruments sense things remotely; that is, they tell us about the properties of clouds and smoke from far away, like how we use a telescope to observe stars. In our case, we use instruments like a radar to look at precipitation and a lidar (a laser that provides information about a what’s between the plane and the ground) to look at the smoke plume’s structure.

Top-left: Mary Kacarab and Amie Dobracki operate in-situ instruments studying the chemical properties and cloud-forming ability of aerosol particles. Top-right: One of the P-3 propellers visible outside an aircraft window. Bottom-right: Cody Winchester and Nikolai Smirnow operate a suite of in-situ instruments to study a variety of smoke properties. Bottom-left: The P-3 post-landing in São Tomé after the August 24 flight. Credit: Michael Diamond

Of course, the in-situ instruments that measure clouds aren’t much use when flying through smoke above the clouds, and when we fly high to get good lidar profiles, we can’t get in-situ smoke measurements. In addition, some of the remote sensing instruments don’t work well when high clouds are present, and the smoke and low clouds aren’t always in the same place from one day to the next. How do we balance all these competing objectives to produce a flight that collects high-quality, usable data? That’s where the forecasting and flight-planning team comes in.

As a graduate student at the University of Washington in Seattle, my role in ORACLES is to look at model forecasts from computer simulations and satellite imagery and then use flight-planning software to create flight plans that will meet our scientific objectives. On what we call routine flights, that mostly means picking altitudes and aircraft maneuvers rather than locations, because for these flights we always stick to the same north-south track to build up statistics that can be used to compare our observations with various computer models.

One example of the choices that have to be made here is whether to do stacked legs, in which we fly over the same location at different heights, or sequential legs, which let us cover more ground because we don’t need to backtrack and instead gives us observations at slightly different locations that might be harder to interpret. A similar choice has to be made when we switch between altitudes: we can ramp down and cover a lot of ground, or do a square spiral and get a vertical profile over the same location.

Time-lapse video of a square spiral maneuver over a relatively uniform field of low clouds during the August 24th routine flight. About 10 minutes elapse in the span of this video. Video credit: Michael Diamond.

The other type of flight we call a flight of opportunity, in which we have more latitude in choosing our flight location to sample interesting features, or to avoid pitfalls like high clouds, that are identified by the models.

We were also able to combine flight plans so that the flights of opportunity could resample air that we observed a day or two earlier. Ideally, to study how the smoke evolves during the course of its journey over the Atlantic, we would be able to follow it as the winds push it westward and downward over a period of days. Unfortunately, this is not at all practical in an aircraft with nine hours’ worth of fuel. Instead, we can run a weather forecast model to predict where the air we sampled during a routine flight will end up in a few days. Then, like an advanced game of connect-the-dots, we can design our next target of opportunity flight to hit the right location and altitude to resample that air to see how it’s evolved.

Example of a resampling flight plan conducted on the August 15th routine flight (dark blue line) and August 17th flight of opportunity (cyan line). The blue gradient lines represent the motion of air parcels first sampled on the 15th (dark blue) and then resampled 2 days later on the 17th (light blue). Black dots represent the location of the air parcels after 1 day. Credit: NOAA Air Resources Laboratory/Michael Diamond

Our August 17 flight of opportunity was a bit special because, rather than return to São Tomé, the P-3 landed on Ascension Island in the middle of the South Atlantic Ocean so we could do some joint flights with a British team studying similar science questions. On the way to Ascension, we planned our track to intersect the new (forecasted) locations of a few different smoke plume air parcels that we sampled on August 15.

Now that the 2017 ORACLES deployment is over, the task ahead of us will be to analyze the data we collected in flights like the August 15-17 resampling mission to produce new scientific insights into this unique smoke-cloud system. Within a year, all of our data will become public at https://espoarchive.nasa.gov/archive/browse/oracles so that other researchers across the country and around the world will be able to contribute their own research and generate new ideas and solutions. The data from last year’s deployment, which took place in September and was based out of Walvis Bay, Namibia, is already available. However, we’re not done with data collection just yet: We’ll be heading back into the southeast Atlantic next year for one last deployment, this time in October to characterize the end of the southern African fire season.

Over the Cloudbow with ORACLES in the South Atlantic

A view from the window of the P-3. A layer of smoke is visible over patchy clouds. This is somewhere over the Atlantic Ocean, quite possibly near the [0˚, 0˚] point, where the Prime Meridian crosses the Equator. Credit: NASA/Kirk Knobelspiesse

by Kirk D. Knobelspiesse / SÃO TOMÉ & PRÍNCIPE /

We can’t build a scale model of planet Earth to study in a laboratory, but we can on a computer. But how do we know a computer model we’ve built is right—or even how to build it in the first place? For atmospheric scientists like myself, the answer is measurements: from satellites, from instruments on the ground, and from airplanes.

This is how I find myself on the small African island of São Tomé, curled up inside the ‘bomb bay’ of a NASA P-3 aircraft pouring liquid nitrogen into a specialized camera called the Research Scanning Polarimeter (RSP). This is a long way from home: I work at the NASA Goddard Space flight center in Greenbelt, Maryland.

The NASA P-3 aircraft on the ground in São Tomé. The Research Scanning Polarimeter (RSP) is located in the “bomb bay,” in the fuselage just forward of the engines. It has a small amount of space for somebody to crawl in and perform instrument maintenance. Credit: NASA/ Kirk Knobelspiesse

So, why São Tomé? We’re pretty close to a phenomenon that beguiles climate models and is difficult to observe by satellites – so we need to fly there instead. It all starts with ocean currents, which bring cold, deep ocean water to the surface (known as upwelling). There’s a strong current off the southwest coast of Africa called the Benguela current. The upwelled water, in turn, causes a low, semi-permanent cloud deck to form at certain times of the year – much like June Gloom in Southern California, for example. From a climate perspective, these clouds can be cooling because they reflect the sun’s energy back to space. What’s unique about where we are is that there is a tremendous amount of biomass burning nearby in sub-Saharan Africa, from both agricultural fires and natural forest fires. The smoke from these fires gets blown west, out over the clouds.

A map of our study area off the western coast of Africa. The image, from the NASA’s Moderate Resolution Imaging Spectroradiometer, or MODIS, instrument on the Terra satellite, shows the persistent marine stratocumulus cloud deck created by cold water from the Benguela current (the black stripes being unobserved segments between orbits). Smoke is visible as a haze over the African continent. São Tomé, Walvis Bay, Namibia (where we were last year) and Ascension Island (where we have flown for overnight stays) roughly bound our region of interest. Credit: NASA

Atmospheric scientists call suspended particulate matter “aerosols”—and smoke is a type of aerosol. When suspended above clouds, aerosols can do a couple of things that impact climate. Most directly, smoke aerosols make the clouds look darker, meaning that less of the sun’s energy is reflected back to space. But the aerosols can also modify cloud properties by serving as seeds for cloud droplet formation, for example, or modifying the temperature of the atmosphere, changing how clouds form.

We know all of these things happen, and we include them in our climate models. The uncertainty boils down to how often they occur, and to what magnitude. The root of the problem is that we don’t have all the measurements we need. Satellites provide a nice snapshot, and many of our colleagues at NASA and elsewhere develop instruments especially devoted to the measurement of clouds and aerosols. They don’t, however, simultaneously measure all of the things we need to know, such as the optical and chemical properties of smoke and its exact location, or smoke in the act of modifying cloud properties.

This is why field campaigns, which make targeted observations to resolve specific scientific questions, are so important. I’m here as part of the ObseRvations of Aerosols above CLouds and their intEractionS (ORACLES) field campaign. (Yes, we love our tortured acronyms.). Last year, we sent two airplanes stuffed to the gills with instruments to Walvis Bay, Namibia, and we flew northwest to our area of interest. This year, we’re flying south and west from São Tomé. We’ll return again next year.

This year we’re working with one aircraft: the NASA P-3. The P-3 is a four-engine turboprop designed as a maritime surveillance aircraft for the US Navy. It is ideal for our purposes because of its endurance, size and ability to fly at very low altitudes. We have a wide variety of instruments on the P-3. Some are in situ, meaning they sample the air as the P-3 flies through a cloud or the aerosols, and they tell us size, chemical composition, and other information specific to the aircraft location. Others are remote sensing instruments, meaning they observe the scene from a distance (usually above). Examples include a downward looking precipitation radar, or a lidar, similar to a radar but using a pulsed laser beam instead of radio waves.

The RSP instrument station inside the P-3 aircraft. Our job in flight is relatively simple: only three switches, a keyboard, and a tiny display to manage. Credit: NASA/Kirk Knobelspiesse

The Research Scanning Polarimeter (RSP) also falls in the remote sensing category. It is a passive scanner, meaning it makes a measurement of light reflected from a location under the aircraft at many different angles. One thing we’re looking at is the cloud bow, which is similar to a rainbow, but involves refraction of light from cloud—not rain—droplets. Precise measurements of the cloudbow can tell us the size of the cloud droplets at the top of a cloud, which in turn indicates the cloud meteorological state, whether or not the aerosols are interacting with the cloud, and so forth. We can also determine optical properties of aerosols above the cloud, but analysis of the data requires lots of computing power and can’t be performed easily in the field. My primary role in ORACLES is to improve this analysis, and along with my colleague, Michal Segal Rozenhaimer, we’re looking into using a type of artificial intelligence to “train” a computer to analyze our data.

This is largely done at home, so here in the field my job is to be one of the team members that ensures the RSP is working properly. This means operating the instrument in flight, participating in creating flight plans, and, yes, periodically pouring liquid nitrogen inside. (The instrument sensors work best when they’re very cold.) So even if the “bomb bay” is cramped and noisy, and I’m quite literally thousands of miles from home, I feel very fortunate to be here and a part of this field campaign.

Solo Science Flying at 65,000 Feet

by Ellen Gray / WALVIS BAY, NAMIBIA /

Stu Broce loves flying high.

“The view is incredible. You can see 300 miles away,” he said from the cockpit of NASA’s high-altitude ER-2 research aircraft. “You can see the curvature of the Earth. If you look up, the sky is very dark blue.”

Of course, for the ORACLES mission now in Namibia studying low-level clouds and aerosols over the south-east Atlantic Ocean, the view of never-ending white is not going to be quite so exciting for the pilots, he added with a grin. There’s more to flying high than the view.

Pilot Stu Broce in the cockpit of the ER-2. On a flight day he’ll be wearing a spacesuit to protect him from low pressures at high altitude. Credit: NASA/Jane Peterson

“I kind of like the solitude, too. It’s my happy place. No matter what’s going on in my life, when I close the canopy, and especially when I leave the ground, I know I’ve got 12 hours of alone time. Busy alone time,” Broce said.

A retired Navy pilot, Broce flew commercial for nearly a year before post-9/11 furloughs led him back to the military, this time the Air Force, where he learned to fly the high altitude aircraft. As luck would have it, around the time he was retiring, NASA was hiring, and Broce has been flying the ER-2, as well as other aircraft, for NASA for the last five years at Armstrong Flight Research Center in California. He’s one of two pilots flying the ER-2 for the ORACLES mission this month.

NASA’s ER-2 lands at Walvis Bay Airport, Namibia. Behind it is the chase car driven by the second ER-2 pilot with a radio to be an extra pair of eyes for landing. Credit: NASA/Brian Rheingans

It’s a challenging aircraft to fly. Landing in particular. “It’s like landing a big 30,000 pound bicycle,” he said. The ER-2’s two main sets of wheels are under the body. The wheels that prop up the wings on the ground drop off during take-off and don’t fly.

The ER-2 is a small, lightweight airplane with a single occupant: the pilot. Its job is to get the long view of the clouds below. Tucked into its nose, body and a pod under each wing, the ER-2 carries four remote-sensing instruments to 65,000 feet, twice the altitude of commercial airliners.

“The only people higher than us are the astronauts in the space station,” said Broce. “We fly so high, we fly above Armstrong’s line at 60 to 62,000 feet, where if you took a cup of water at altitude outside the plane, the water would boil just because of the low pressure there, even though it’s super cold.”

People don’t do so well at those low pressures. The pilots wear space suits that will pressurize in case of a loss of cabin pressure. Part of their prep is to breathe pure oxygen for an hour before flight to purge the nitrogen from their bodies so they don’t get the bends when they ascend so quickly. Food and water for the eight plus hours in flight both come through a tube – applesauce, pear-sauce, and peach-sauce are among Broce’s favorites, which he said are actually pretty good.

The ER-2 in the hangar at Walvis Bay Airport. The pod under the visible wing is open where a science instrument is installed. Credit: NASA/Jane Peterson

The instruments, on the other hand, do great at 12 miles above the Earth. While they’re not as high as satellites, some of the instruments simulate satellite measurements. Aboard the ER-2 they both test out new technology and software and get the equivalent of satellite data right where the scientists want it.

The science team is trying to understand the interaction of clouds and tiny airborne particles – smoke from fires central Africa – and how they change the amount of energy absorbed or reflected from the clouds, a key component for assessing how clouds affect Earth’s climate.

Brian Cairns of Goddard’s Institute for Space Studies works on the Aerosol Polarimetry Sensor in the pod under the ER-2 wing. Credit: NASA/Jane Peterson

Broce helps out with gathering the data. The instruments are as fully automated as can be, but he still needs to turn them on after take-off and sometimes during flight switch their modes.

“I like to count the number of button presses per hour. It’s ‘BPH’ — my term. If it’s above ten, I consider that busy because you have to read checklists and know when to hit the button and check miles and time and locations. We also have to navigate and fly the plane, sometimes to precise navigation or headings, and then push the buttons.”

At the end of the day, the goal is to return measurements to scientists waiting on the ground.

For more on Broce’s work as ER-2 pilot for ORACLES, visit Notes From the Field: ORACLES in Namibia 2016.

(Note: This wraps up our reporting from Namibia. Click here for all the ORACLES blog reports.)


Into Africa Seeking the Desert Sun

by Ellen Gray / GOBABEB, NAMIBIA /

Brent Holben stands in the shade of his car’s hatchback door, squinting at his phone. He’s checking Google Maps. From the dirt parking lot at the Walvis Bay Airport, Namibia, he temporarily has free internet access to the NASA wifi hotspot set up for NASA’s ORACLES airborne science campaign here.

“I don’t want to make a wrong turn,” he says. “Of course out here, that’s pretty hard. There’s not many turns.”

Gobabeb Research and Training Centre in Namibia. Credit: NASA/Jane Peterson

With a trim gray beard and brimmed hat, Holben, a scientist at NASA’s Goddard Space Flight Center in Greenbelt, Maryland, is in charge of the ground sites that will measure aerosols to complement observations made by ORACLES’s two research aircraft.

Today, Holben is heading out on a road trip southeast of Walvis Bay to the Gobabeb Research and Training Centre, 40 miles as the crow flies from the coast. There, perched atop a short tower, is one of Holben’s aerosol measuring instruments, a sun photometer that is part of the Aerosol Robotic Network. AERONET, which began in 1992 with two sensors, now has 600 sensors worldwide, but not as many in Africa as Holben would like.

Brent Holben, project scientist for the Aerosol Robotic Network (AERONET) from NASA’s Goddard Space Flight Center. Credit: NASA/Jane Peterson

“Africa is a giant place, and it’s underrepresented compared to Europe and the United States.” Holben is the AERONET project scientist.

As ORACLES was being planned to make measurements of aerosols over the southeast Atlantic Ocean from aircraft, he originally drafted plans for two AERONET instruments in Namibia that would study aerosols from the ground. He ended up setting up ten.

A sun photometer has one job: to look at the sun to see how many aerosols are between it and the ground by measuring the light energy that reaches the instrument.

The AERONET sun photometer at Gobabeb points at the sun and measures the light energy that reaches it. Since scientists know how much energy the sun produces at the top of the atmosphere, any difference measured by the instrument at the ground is caused by "stuff" – aerosols like smoke, dust, and sea salt – between the top of the atmosphere and the ground. From that scientists can calculate aerosol concentrations in the atmosphere. Credit: NASA/Jane Peterson
The AERONET sun photometer at Gobabeb points at the sun and measures the light energy that reaches it. Since scientists know how much energy the sun produces at the top of the atmosphere, any difference measured by the instrument at the ground is caused by “stuff” – aerosols like smoke, dust, and sea salt – between the top of the atmosphere and the ground. From that scientists can calculate aerosol concentrations in the atmosphere. Credit: NASA/Jane Peterson

“If the set-up weren’t simple, I wouldn’t do it,” Holben said of the solar-powered instrument.

But simple doesn’t mean without complications. One reason Holben is visiting Gobabeb is because he’s concerned about the instrument shutting down unnecessarily due to the region’s characteristic fog.

The sky is overcast on our drive south, which is not uncommon along the Namibian coast. Early morning fog develops when warm air condenses over the cold ocean water, and then it rolls over the length of the coast and inland. It’s the main source of water for much of the vegetation that grows where it can across the plain.

Not far from the airport the asphalt disappears and we’re driving on a dirt road. To either side the rocky desert is white-beige and flat, textured with small rocks and dotted with occasional buildings that grow fewer and farther between.

On the horizon ahead, great sand dunes appear, first as bumps, then looking like orange mountains. Eventually, a green strip comes into view at the base of the dunes. Holben points out as the green strip resolves into trees. “That’s the river.”

The river is the Kuiseb (pronounced kwee-sib), and it’s dry for most of the year.  During the rainy season from November to January or so, it may have water for a few months, replenishing the groundwater for the trees – and everything that eats their leaves – to live on for the rest of the year.

The road turns east and from here parallels the river into the Namib-Naukluft Park and to Gobabeb Centre where it dead-ends. Along the way are the farms of the local Topnaar community, which has lived along the Kuiseb for the past 600 years. Many have day jobs in Walvis Bay to supplement their living. Along the river they raise cattle and other livestock.

House in the desert near the Kuiseb River. Credit: NASA/Jane Peterson

“It’s a harsh existence. You’ve got to admire people who eke out a living here,” said Gillian Maggs-Kölling, the Gobabeb Centre’s executive director. The centre is located next to three ecosystems: the rocky plain, the linear oasis of the river, and the 1,000-foot sand dunes that roll into the Sand Sea to the south.

Maggs-Kölling is a biologist, as are most of the 18 researchers and students who live and work there. It’s an international mix, with students from the Namibian University of Science and Technology joined currently by a group from the University of Basel in Switzerland, and a handful of others from various other European and American universities.

The main building with labs and offices is surrounded by a spread of low cottages and gardens of scientific instruments measuring temperature, moisture, and a dozen other things. Completely off-grid, the site is powered by solar panels with the occasional help of a generator.

This is Holben’s third trip to Gobabeb, one each year since setting up the AERONET sensor here.

“We came here because we didn’t have an instrument in this part of the world. The Namib Desert is quite unique because it is influenced by fog,” said Holben. He and the ORACLES team hope to learn how the aerosols they’re measuring affect the fog and the clouds over the ocean.

We meet Monja Gerber, a relatively new technician and Masters student in plant physiology from North West University in South Africa, who is taking care of the instrument this year.

Brent Holben walks Monja Gerber through maintaining the AERONET instrument at Gobabeb. Credit: NASA/Jane Peterson

Atop the two-story tower where the AERONET instrument sits, Holben shows Gerber a few maintenance tricks. The instruments tube is open and sometimes spiders or bees like to make homes in them, he points out. Holben shows her how to disconnect the wet sensor that triggers when fog collects on it.

As the day warms, morning fog that rolls in from the coast clears. Using its own GPS location and the time of day to find the sun, the AERONET photometer spins into action.

“We’re looking at two main aerosols in this region. Dust blown from the desert is one, which is actually a very small component. The big one is smoke from fires in central Africa. These are man-made agricultural fires as people clear their land at this time of year,” said Holben.

Westerly winds take the smoke from the Democratic Republic of Congo, Zambia, and Angola, and carry it out over the southeast Atlantic, where ORACLES’s two research aircraft measure it to see how the smoke changes sunlight absorption or reflection – important to know for understanding and predicting climate change. That smoke arcs back to Namibia on south-easterly winds.

“We’ve been watching the aerosols day by day for ORACLES,” Holben said of both the measurements here at Gobabeb and the six sensors that are set up in Henties Bay, an hour north of Swakopmund. “Over the last several days, the optical depth went from almost background conditions to – yesterday – moderately high.”

Light scattered by the smoke aerosols makes sunsets here red, Holben added.

The sunset is spectacular. Holben and his son Sam, who accompanied him on the trip, cross the river and climb to the top of the nearby dune to watch. They leave with barely enough time, and Sam, not wanting to miss it, runs ahead and picks the steepest ascent.

Brent Holben and his son, Sam, hiking toward the top of a dune to catch the sunset. Credit: NASA/Jane Peterson

Climbing a dune of fine sand is not easy, and he slides down nearly as much as he climbs, but persistence gets him to the top. Holben takes a less-steep approach and settles in for the show.

From the top, the Namibian landscape stretches as far as the eye can see, changing colors as the sun sinks behind the dunes in the west. The stars slowly come out and the Southern Hemisphere constellations brilliantly shine beneath the sweep of the Milky Way.

Sunset at Gobabeb, Namibia. Credit: NASA/Jane Peterson


On the ‘Positively Radiant’ Research Flight

by Ellen Gray / WALVIS BAY, NAMIBIA /

The ORACLES science team is in southern Africa to fly.

The bulk of their work is done in the narrow confines of the stocky P-3 aircraft amid racks of customized instruments. In the coming weeks these instruments will be complemented by remote sensors on the high-altitude ER-2 aircraft. But while the ER-2 team waits for the arrival of their specialized fuel, the science flight on September 2 is all P-3.

For this 8:00 a.m. flight, wake up time is early but you wouldn’t know it for the palpable sense of excitement the scientists have as they board the plane. This is the first “flight of opportunity;” the theme: It’s Positively Radiant Research. The flight will focus on the energy balance of the clouds over the ocean: how much light are clouds reflecting or absorbing as they interact with the smoke aerosols that travel from agricultural fires in central Africa.

David Noone of Oregon State and Ken Sinclair of NASA’s Goddard Institute for Space Studies are measuring the isoptopic fingerprint of water vapor that can tell them how much aerosols and clouds are mixing together. Credit: NASA/Jane Peterson
David Noone of Oregon State (left) and Ken Sinclair of NASA’s Goddard Institute for Space Studies onboard the P-3 research aircraft are measuring the isoptopic fingerprint of water vapor that can tell them how much aerosols and clouds are mixing together. Credit: NASA/Jane Peterson

The inside of the P-3 looks like a laboratory with big boxy instruments in front of airline seats. Twenty-four scientists can fly at a time with more than a dozen instruments. Once everyone’s aboard, ears safely covered by noise-cancelling headphones, the turboprop engines fire up. The P-3 taxis down the runway and takes off.

NASA’s P-3 research aircraft, ready to fly from Walvis Bay, Namibia. Credit: NASA/Jane Peterson
 The inside of the P-3 holds racks of science instruments and their science teams. Credit: NASA/Jane Peterson
The inside of the P-3 holds racks of science instruments and their science teams. Credit: NASA/Jane Peterson

This is a LOUD plane – deafening, in fact. The headsets have the dual role of hearing protection and allowing everyone on board to communicate, reporting real-time observations. Sebastian Schmidt of the University of Colorado, Boulder is the flight scientist  today. Sitting up front, his is the single voice speaking to the pilots, relaying any requests for adjustments in the flight path that come from the instrument teams.

The pilots, Mike Singer and Mark Russell of NASA’s Wallops Flight Facility, have final say on the flight path. They are responsible for the safety of the plane and its occupants. With hundreds of science flight hours under their belts, they’re very familiar with how scientists like to fly. Today it’s in tight spirals from the top of the smoke layer and clouds to near the ocean surface to see what the air is doing along a vertical column.

Sebastian Schmidt of the University of Colorado Boulder is the flight scientist on Sept. 2 keeping track of all activities aboard the P-3. Credit: NASA/Jane Peterson

On this eight-hour flight, though, the science team channel isn’t all business. “Who still needs a nickname?” Sam LeBlanc of NASA’s Ames Research Center in charge of the 4STAR instrument asked at one point.

A number of the flying scientists apparently still do. Among them, Sabrina Cochrane, a second-year grad student at the University of Colorado, Boulder, manning the Solar Spectral Flux Radiometer. This is her first research flight.

“I was really nervous,” she said after the flight. “I thought I was going to feel sick the whole time with all the spirals, but I didn’t. It was really smooth. It was a lot more fun than I expected.”

 For Sabrina Cochrane of the University of Colorado Boulder, this is her first research flight. Credit: NASA/Jane Peterson
For Sabrina Cochrane of the University of Colorado Boulder, this is her first research flight. Credit: NASA/Jane Peterson

Flying between the spiral locations, the Airborne Precipitation Radar team was on the look-out for another high-flyer: the CloudSat satellite in space, which was scheduled to make a pass over the same region the P-3 was flying. This radar measures cloud droplet sizes and numbers, validating the same measurements taken from space by CloudSat’s radar.

The satellite overpass was not exactly over the flight path, but close enough, said Steve Durden of NASA’s Jet Propulsion Laboratory. “Even if they’re not perfectly aligned you’ll see the same structures in the clouds,” he said.

The final maneuvers of the day occur during the last hour of flight on the way back to Walvis Bay Airport. David Noone of Oregon State University explained that these maneuvers are for the instruments, to find out how different orientations of the aircraft affect the measurements.

P-3 pilot Mike Singer from NASA’s Wallops Flight Facility guides the aircraft through maneuvers designed to collect maximum measurements of aerosols and clouds. Credit: NASA/Jane Peterson

“My measurements, the water vapor and the water vapor isotope measurements, are a good example of this. We’re bringing in air from outside through an inlet that must be pointing directly forward into the flow. If it’s slightly off, the number of cloud droplets that enter the inlet might vary,” he said.

To test out the orientations the pilots will wiggle the tail of the aircraft, roll side to side, and go up and down like they’re going over a hill.

“Now some of these are good fun,” said Noone, “but we’re sitting here in the back of the aircraft. We’re way out in the tail so we’re going to get a good ride.”

NASA’s P-3 flies above clouds over the southeast Atlantic ocean to study their interactions with smoke. Credit: NASA/Jane Peterson


Andrew Dzambo from the University of Wisconsin (left) and Steve Durden from NASA’s Jet Propulsion laboratory monitor the Airborne Precipitation Radar which measures cloud droplet size aboard the P-3. Credit: NASA/Jane Peterson


On the Hunt for the Perfect Science Flight

by Ellen Gray / SWAKOPMUND, NAMIBIA /

Planning a science flight does not appear to be most exciting part of a NASA airborne mission, even from an exotic location like the Namibian coast where we are now for the ORACLES mission. No planes. No high-altitude views. Just a group of people on computers sitting at long tables in a windowless conference room staring intently at a projector screen.

“I couldn’t disagree more that it’s unglamorous,” said ORACLES principal investigator Jens Redemann of NASA’s Ames Research Center. “I am so excited to be here planning the flights. It’s the promise of a great flight, like visualizing the greatest possible outcome. It’s the perfect flight that we’re on the hunt for every time. You don’t think about anything else while you’re flight planning.”

ORACLES principal investigator Jens Redemann listens intently to the forecast briefing that will be used for flight planning. Credit: NASA/Jane Peterson

The work they’re doing at this 8:00 a.m. meeting literally drives the mission. The forecasting team shows videos of slow-moving model projections of the clouds and aerosols over central and southern Africa and the Atlantic Ocean all the way out to Ascension Island. Like fishermen discussing where to find the best catch, they discuss in excruciating detail where they think the best clouds and aerosol plumes will be.

Like any other prediction of the future, however, these models are not 100 percent correct all the time.

Pablo Said of the National Center for Atmospheric Research discusses details of the forecast with ORACLES principal investigator Jens Redemann during the weather briefing. Credit: NASA/Jane Peterson

“We know that models aren’t perfect,” said Karla Longo of the Global Modeling and Assimilation Office at NASA’s Goddard Space Flight Center. The Goddard Earth Observing System or GEOS-5 model, for instance, tends to underestimate low-level clouds in this region.

“We have to use it here though so we understand when and why it’s wrong. People don’t always feel good about it, but it’s the only way to improve,” said Longo.

Part of the forecast briefing is devoted to looking back to the previous flight and comparing the forecast for it with what the plane actually found. Over the coming months and years, the ORACLES measurements will be used to update the physics that drive the model.

Meanwhile the science team is riveted because flawed or not, these are the images they need to plan the next flight.

CloudForecast
The cloud forecast made using the UK Met Office’s forecast model on Aug. 31 for the Sept. 2 flight day. It shows clouds at different altitudes in different colors: blue highest, green mid-level, and red lowest. Credit: UK Met Office

On an airborne mission like this there’s not a preset plan of where and when they will fly. Planning is done day by day. It’s a balance between the need for aircraft crew rest and the potential for good clouds and aerosol plumes to measure.

“We’re always concerned about low-level clouds and the amount of smoke in the biomass burning plumes,” said Redemann. “The juggling act is that our science objectives are diverse enough that we look for different plume and cloud characteristics on different days.”

After the forecast briefing to plan the flight for Friday, Sept. 2, Redemann gathers around a whiteboard with a few of the instrument scientists to hash out the nitty-gritty details of the main science section of the flight. The focus of Friday’s flight is radiative balance. They will design the flight plan to maximize the measurements taken by the Solar Spectral Flux Radiometer, which gauges the brightness of the clouds to determine the energy – light – in the atmosphere coming from all directions – directly from the sun, filtered through clouds, and reflected by clouds.

Sebastian Schmidt (center) and his team check the sensor of the Solar Spectral Flux Radiometer that sticks out of the top of the NASA P-3 aircraft. Credit: NASA/Jane Peterson

“The aerosol plume has a different effect on the radiation balance depending on whether the plume is above smooth or broken clouds,” said Redemann. Aerosols can have either a cooling or a warming effect, depending on the brightness of the clouds below. “We’re trying to verify that experimentally in flight.”

The science planning conversation is long and involves a shorthand language, squiggles on the whiteboard and questions like “Do you want to spiral here?”

Once they figure out the science plan, the pilots come in and work with the team to write their flight plans,  including when and where to fly the aircraft from the cloud tops down to a few hundred feet above the ocean surface in a corkscrew-like spiral.

By the end of the day it all comes together, and all that’s left is for the science teams to decide who gets to fly onboard with their instruments.

Mission Operations is set up in a conference room at the Swakomund Hotel in Swakomund, about a 45-minute drive from the Walvis Bay Airport and the NASA research planes. The weather forecast briefing is the highlight of every day. Credit: NASA/Jane Peterson


First Flight: “One of the Best of My Career”

by Ellen Gray / WALVIS BAY, NAMIBIA /

It’s chilly at 6 a.m. at the Walvis Bay Airport on Wednesday, Aug. 31. Only a couple of employees are here, two hours before the usual work day starts, to scan through security the science team for NASA’s ORACLES mission who are getting ready for the first complete science flight.

The airport is less than a year old with commuter flights from across southern Africa. It’s a tiny, two-story terminal, taking barely a minute to walk from one end to the other. It’s waiting area is still shiny and new, with red seats that will be filled by tourists coming and going in a few hours. But for now it is quiet.

A cloud of fine sand billows up as the P-3 moved down the runway at the Walvis Bay Airport. Credit: NASA/Jane Peterson

On the runway in front of the hangar, the crew of NASA’s P-3 turbo prop aircraft readies it for flight. Today’s flight plan is called “Routine 1b.” “Routine” because the track — northwest from the airport over the Atlantic then turning due west — will be the regular route the team will fly over the next month to measure the low-lying clouds off the coast and the layer of aerosols above, primarily smoke from seasonal agricultural fires in central Africa.

The “1b” is for first flight, second attempt. Tuesday’s attempt at “Routine 1” ran into a minor technical issue with the aircraft half an hour into the flight that caused it to return early to base.

“There’s a real sense of excitement now that we’re here,” said David Noone of Oregon State University, one of the 24 scientists who was aboard the P-3 with an instrument to measure isotopes of water vapor. The water vapor that travels with the aerosols has a different fingerprint than the water in the clouds, and the measurements tell him how the two are mixing.

DSC_0052_DavidNoone
David Noone of Oregon State puts together the monitor for his instrument in the hangar at Walvis Bay Airport. Credit: NASA/ Jane Peterson

“We’ve been planning this experiment for three years,” said Noone. “So many people, so many logistics, so many challenges. To be here to start answering these critical science questions that affect future climate is really awesome.”

Aerosols and how they affect clouds are two of the biggest unknowns in climate science. The only way to learn how they work and affect Earth’s energy balance – how much heat sticks on the planet – is to fly through them both.

The P-3 is loud (best wear your ear protection!) when it fires up. Its propellers kick up a cloud of Namibian desert dust as it moves along the runway. At 8:00 a.m., it’s wheels up and they’re off.

Back in Mission Ops, a conference room at the Swakopmund Hotel a good 45-minute drive from the airport, the non-flying ORACLES scientists monitor the flight for the next eight hours. A web page projected on the big screen shows the plane’s location. A chat program allows the Earth-bound team to communicate via satellite with Rob Wood, the ORACLES flight scientist in charge on the P-3.

P-3 flying above stratocumulus clouds and under wispy cirrus clouds above. Credit: NASA/David Noone

“This was my first flight on the P-3,” said Wood, ORACLES deputy principal investigator from the University of Washington, Seattle. “I was a little nervous about what I needed to do as flight scientist. It’s a totally new system to me. But the crew worked wonders to make it easy and get me fit into their system.”

After a long seven-and-a-half-hour flight, the whole science team is happy.

“It’s always good to get that first flight under your belt,” said Wood with a big smile on his face. “It’s even better when it’s such an amazing flight. This was up there with the best of my career.”

After Wednesday’s successful science flight, the science team debriefs in the hangar at Walvis Bay Airport. Credit: NASA/David Noone


In Namibia: Between Dune and Sky

by Ellen Gray / WALVIS BAY, NAMIBIA /

This desert was nothing like what I expected. Flying in to Walvis Bay Airport in Namibia, Africa, unbroken beige stretched as far as I could see out the window, lined with the occasional road and dotted by the occasional black rock outcrop, like islands in the sea.

From the ground at first glance, it’s pretty boring in most directions: big sky and flat sand with little to interrupt the horizon. Until you turn and see what look like orange-ish mountains in the distance. They’re not mountains. They’re dunes. As we drive closer, they keep getting bigger. The Crocodile Dundee voice in my head says “Now, that’s a dune.”

Dunes of the Namib Desert near Walvis Bay, Namibia. Credit: NASA/Jane Peterson

The dunes are the most spectacular feature of the Namib Desert, one of the oldest deserts in the world, that runs the length of the Namibian coast on the western shore of Africa. But it’s the coast – specifically the clouds above the Atlantic Ocean to the west – that have brought a team of NASA and university scientists and two research aircraft to this remote region for a NASA airborne mission: Observation of Aerosols above Clouds and their Interactions (ORACLES).

Offshore are two things that make the coast of Namibia unique in the entire world: a layer of low-lying cumulus clouds and above that a steady layer of smoke particles – a type of aerosol – that are borne westward on the winds from forest and brush fires over central Africa.

NASA's P-3 aircraft is decked out with scientific instruments to study clouds and aerosols. Credit: NASA/Jane Peterson
NASA’s P-3 aircraft is decked out with scientific instruments to study clouds and aerosols. Credit: NASA/Jane Peterson

Aerosols and how they change the behavior of clouds are one of the biggest mysteries in the climate change puzzle. Do aerosols make clouds thicker? Do they reflect more sunlight, or change how much sunlight clouds reflect? Do they absorb sunlight and make the atmosphere warmer? The lessons learned from flying above and through this “perfect natural laboratory,” as principal investigator Jens Redemann put it, will yield insights into cloud-aerosol interactions around the world.

The same conditions that make the low-lying clouds also make the coast really foggy in the morning. The fog is a reliable source of moisture for the plants that cover rocks and boulders sticking out of the sand. Desert-warmed air condenses over cold ocean water to form a marine layer, similar to the ones seen on the California coast.

Swakopmund shrouded in morning fog at 6 a.m. Credit: NASA/Ellen Gray

We are staying in Swakopmund, a tourist town about 45 minutes from the more industrial city of Walvis Bay. This is a former German colony town founded in 1892, and you can see the influence on the architecture. The town is built out rather than up. A constant breeze blows keeping the late August air a nice 70 to 75 degrees Fahrenheit.

As we drive south toward the airport on our first full day here, we’re between two extremes with the Atlantic ocean out the right window and the desert out the left.

DSC_0024
Man walking near the highway on the desert side near Walvis Bay. Credit: NASA/Jane Peterson

The ocean is blue and huge, and vacation rentals dominate a long section of beach, giving way to a view of offshore drilling platforms in the distance as we near the city of Walvis Bay. Like Swakopmund, the city is spread out, and signs on the highway caution to watch out for children crossing between two residential areas.

Sign for Walvis Bay Airport which is off in the distance toward that hill in the top left. Credit: NASA/Jane Peterson

At the southern reach of the city new construction is going up as we turn inland toward the desert and the airport.  The dunes in the distance grow until we pass Dune 7, the tallest in the area at over 1200 feet. Out here, under the sun, the temperature will be in the 90s F by midday.

Soon after we arrive at Walvis Bay Airport, a tiny bump on the horizon that will be the ORACLES base of operations for the next month. A spill of scientists, freshly badged for airport access, disembark out of the shuttle van, ready to go.

Dune 7 from a distance. Credit: NASA/Jane Peterson