A Day in the Life of the Ocean Currents

By Mara Freilich, Postdoctoral Fellow at the Scripps Institution of Oceanography. // ABOARD THE SALLY RIDE //

A whiteboard lists the day's schedule.
Schedule for the day. Credit: Mara Freilich

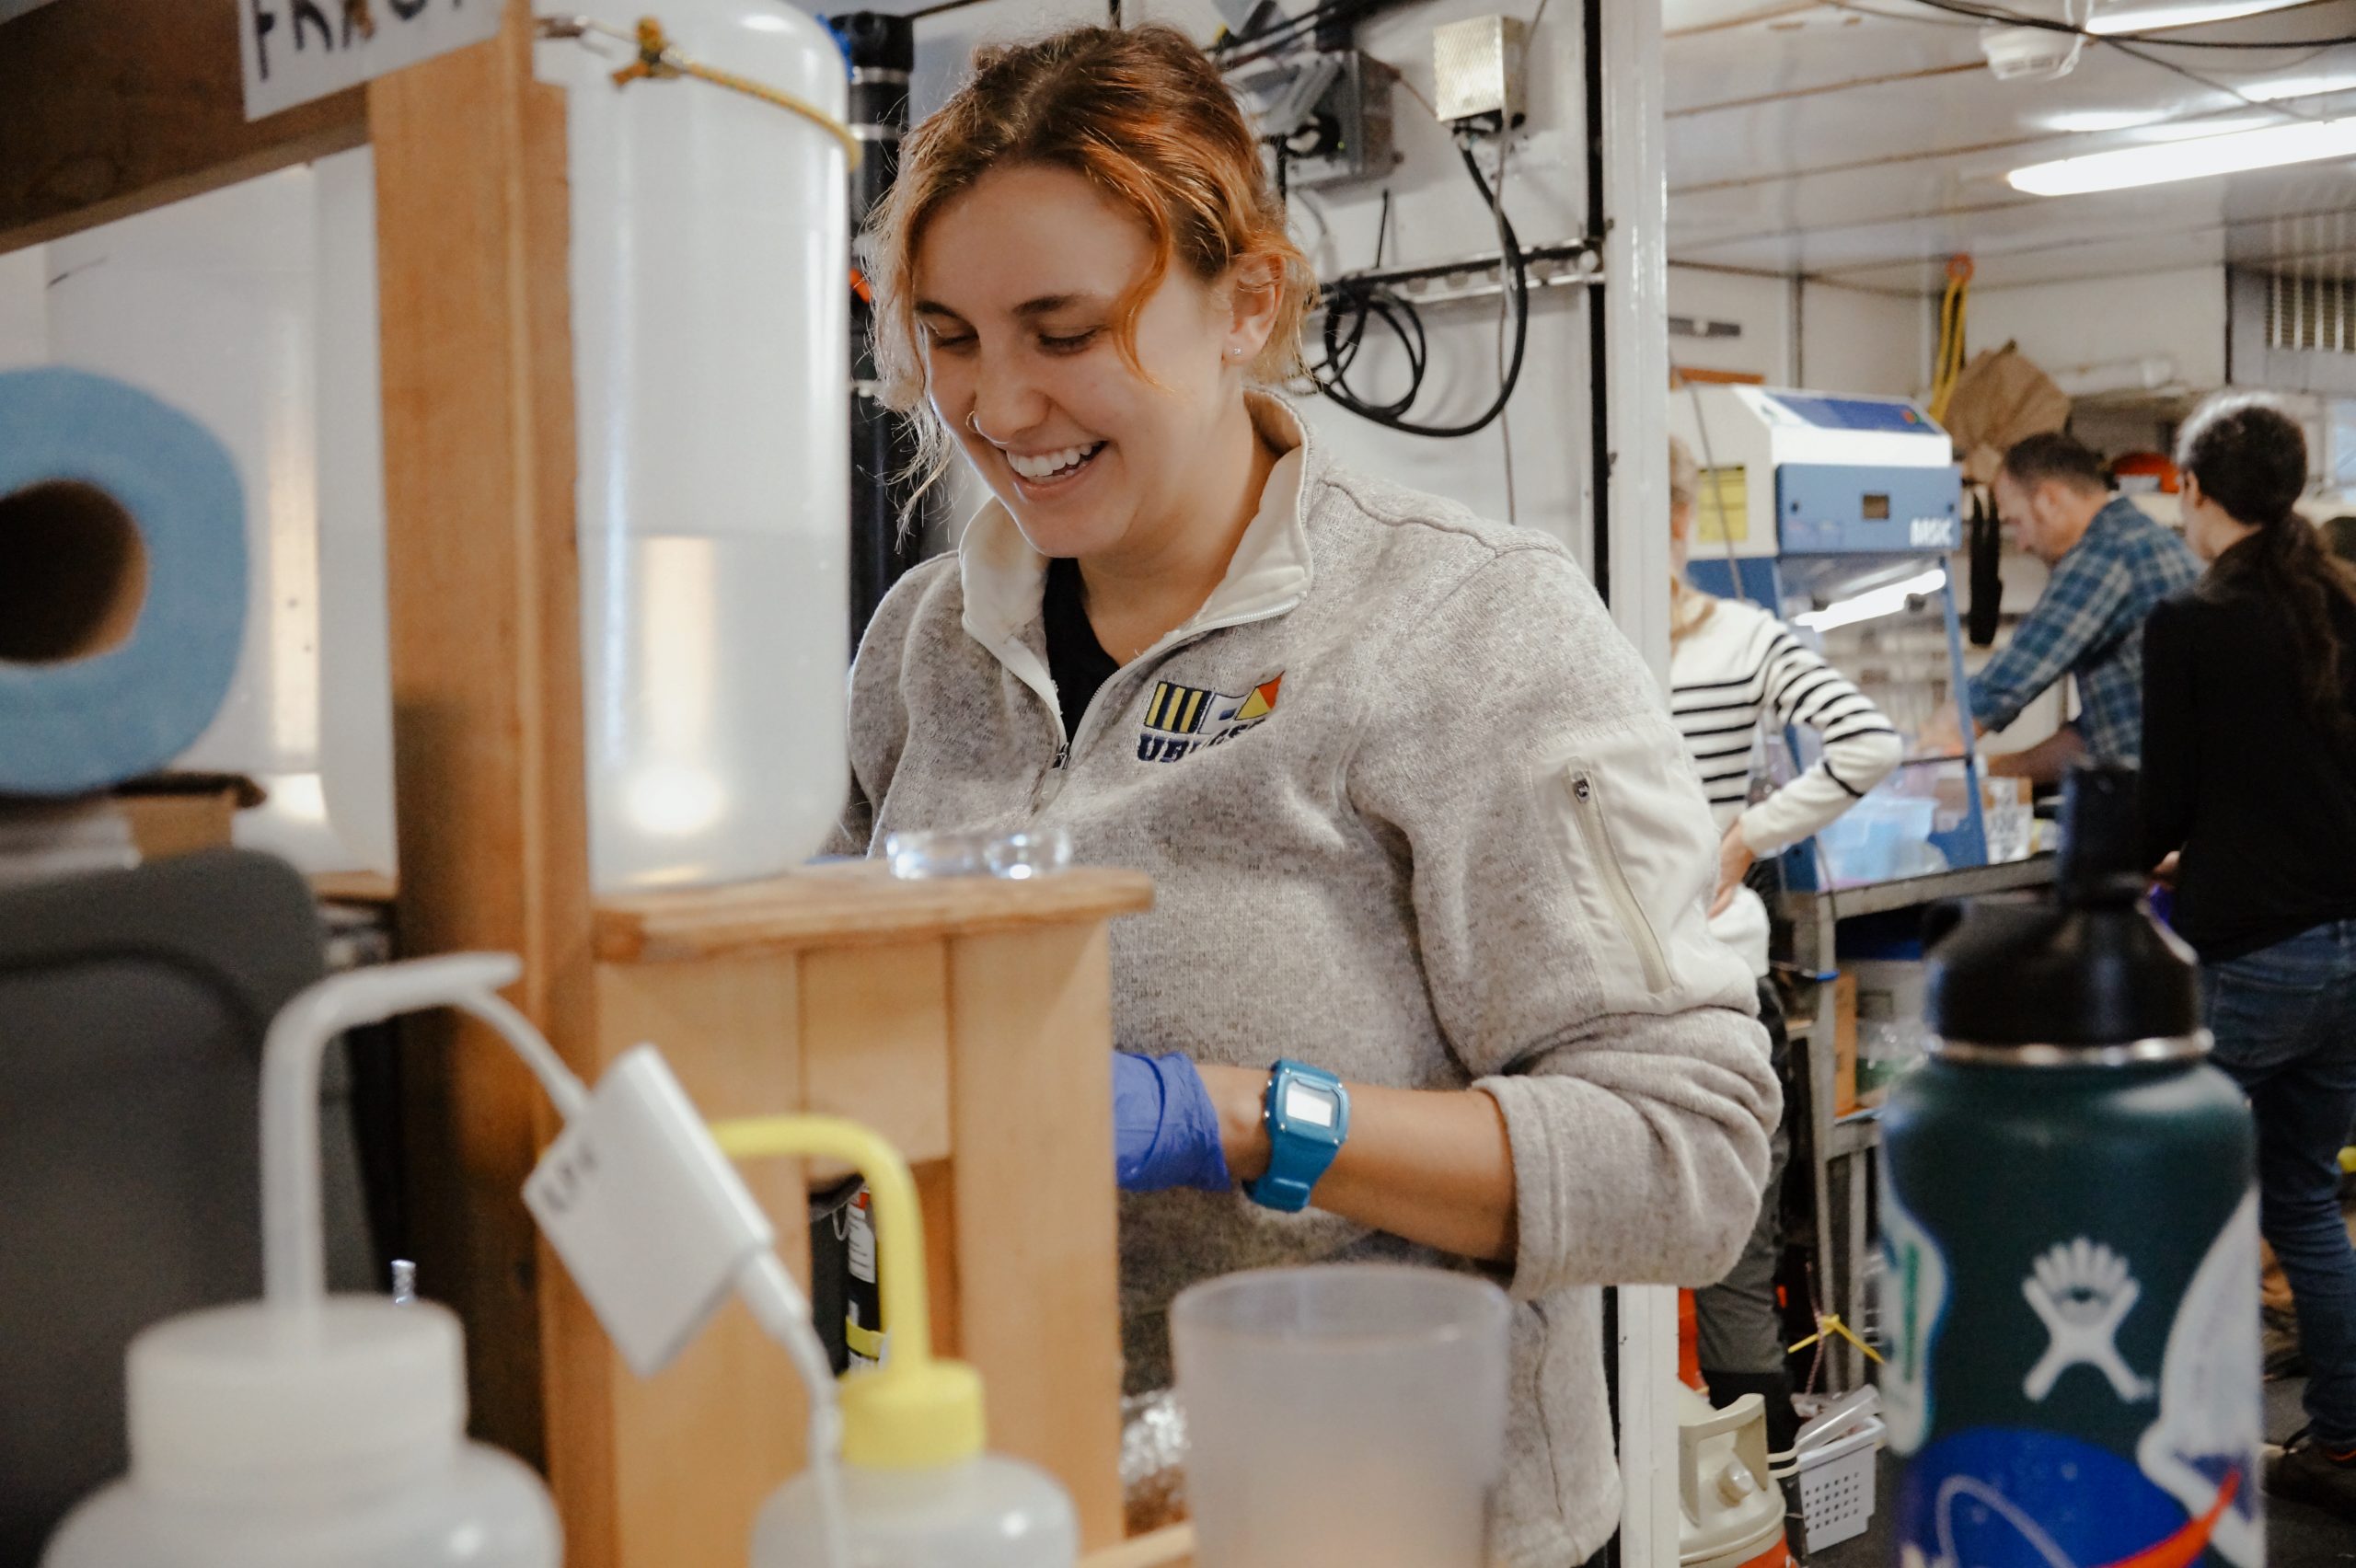
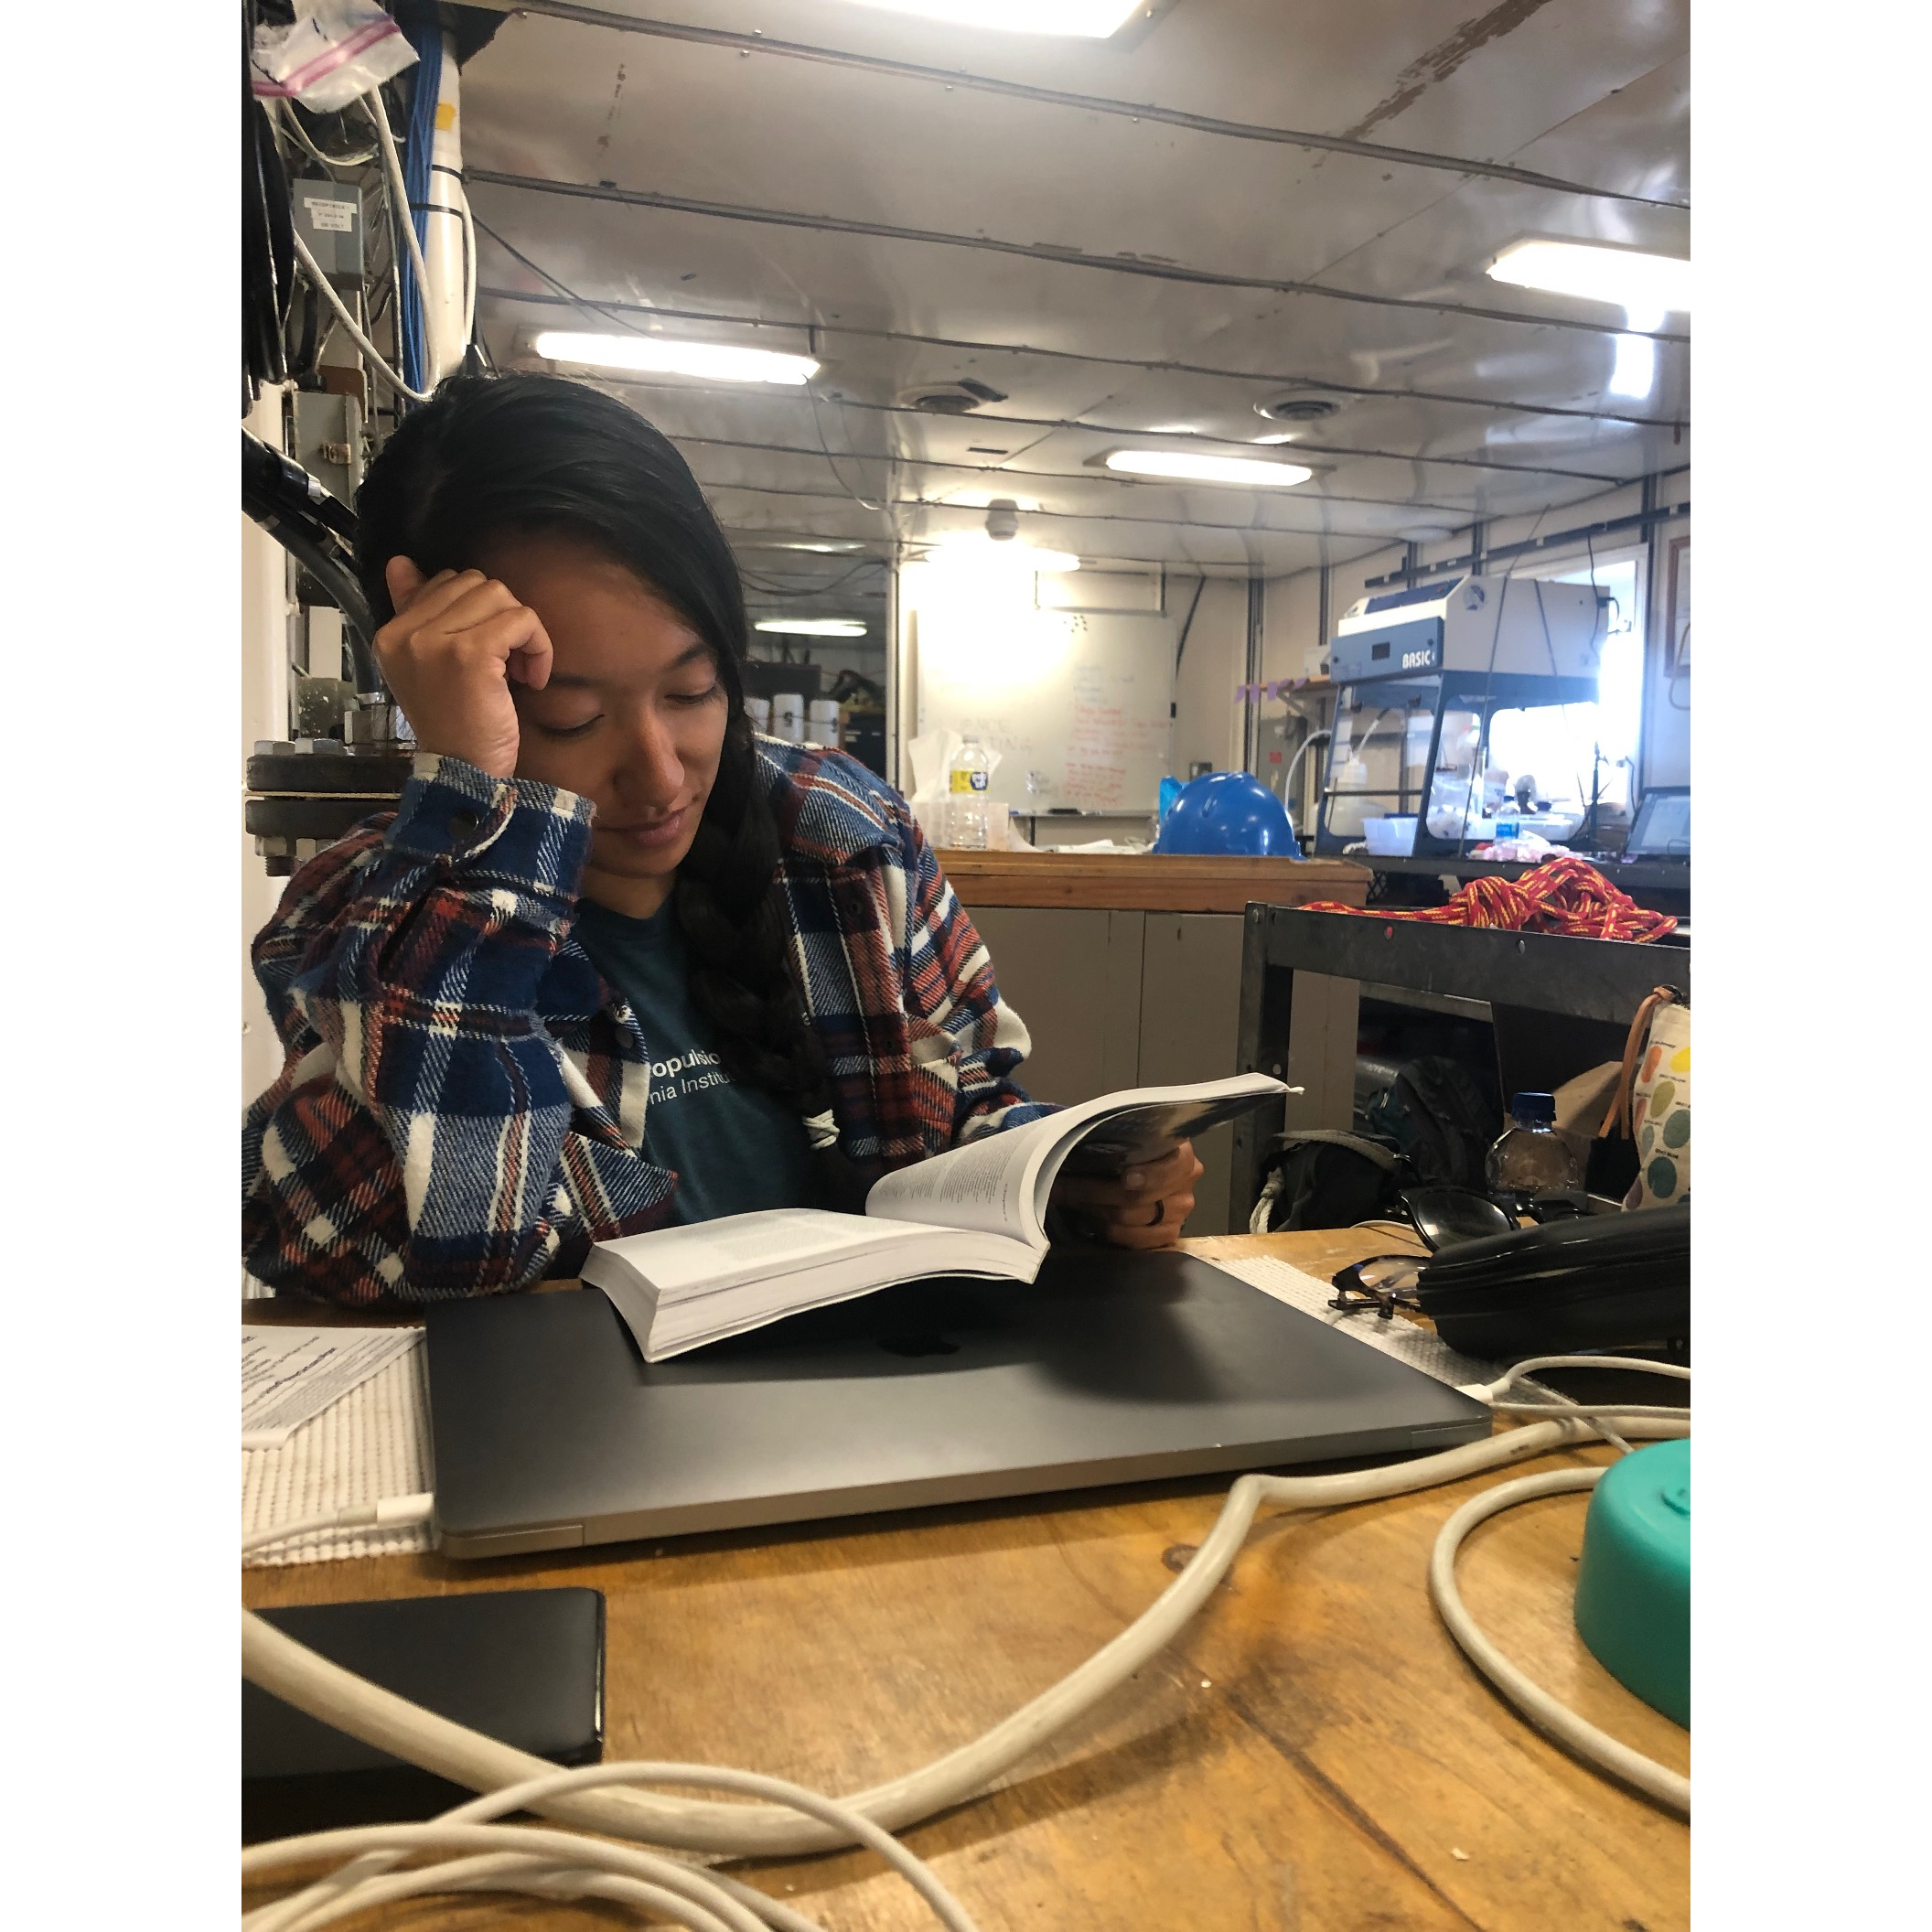
While doing oceanographic fieldwork, we live and work on the ship. This is the second week that we have been at sea. While there is a rhythm to life at sea, every day is different. Since we are studying ocean dynamics that change quickly, we sample adaptively, meaning that we adjust when and where we sample to follow quickly moving ocean features. I am a postdoctoral fellow at University of California, San Diego’s Scripps Institution of Oceanography. I am working on sampling biological communities to understand how ocean currents, particularly a type of current called submesoscale that spans up to 6.2 miles, or 10 kilometers, across, affect plankton, which form the base of the food web in the ocean. We work as a team on the ship, and I work most closely with the biological sampling team: Kelly Luis (NASA’s Jet Propulsion Laboratory), Sarah Lang and Pat Kelly (University of Rhode Island), Dante Capone (UC San Diego), and Élise Beaudin (Brown University).

There is no typical day, but here’s a look at one “day in the life” of the S-MODE field campaign.

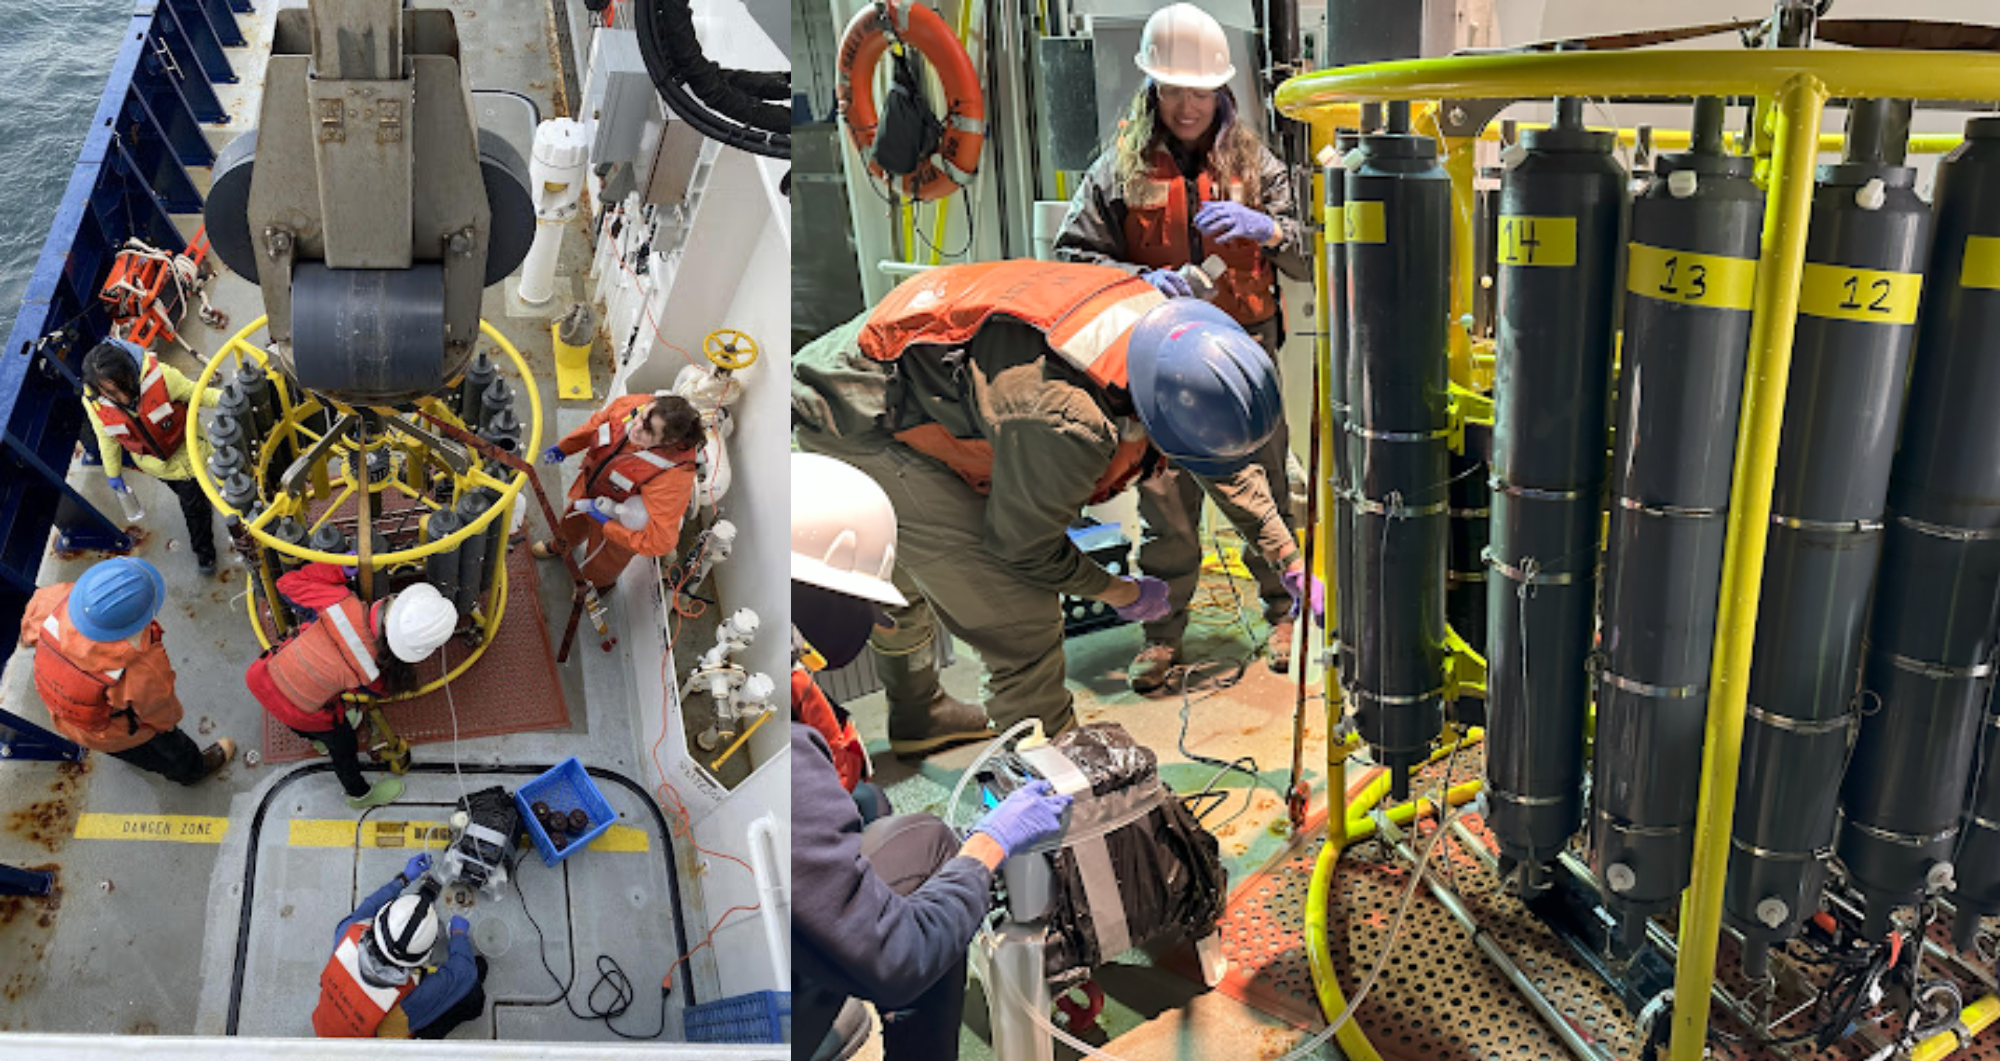
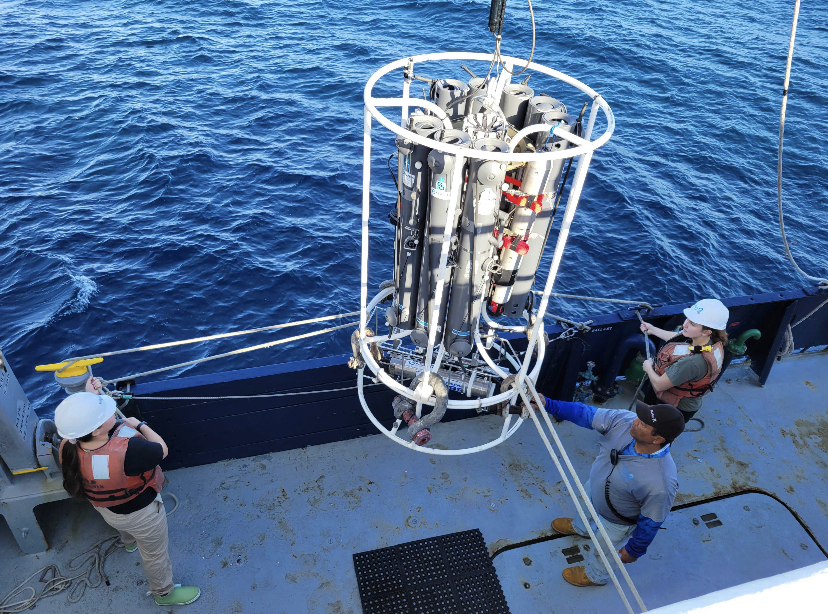
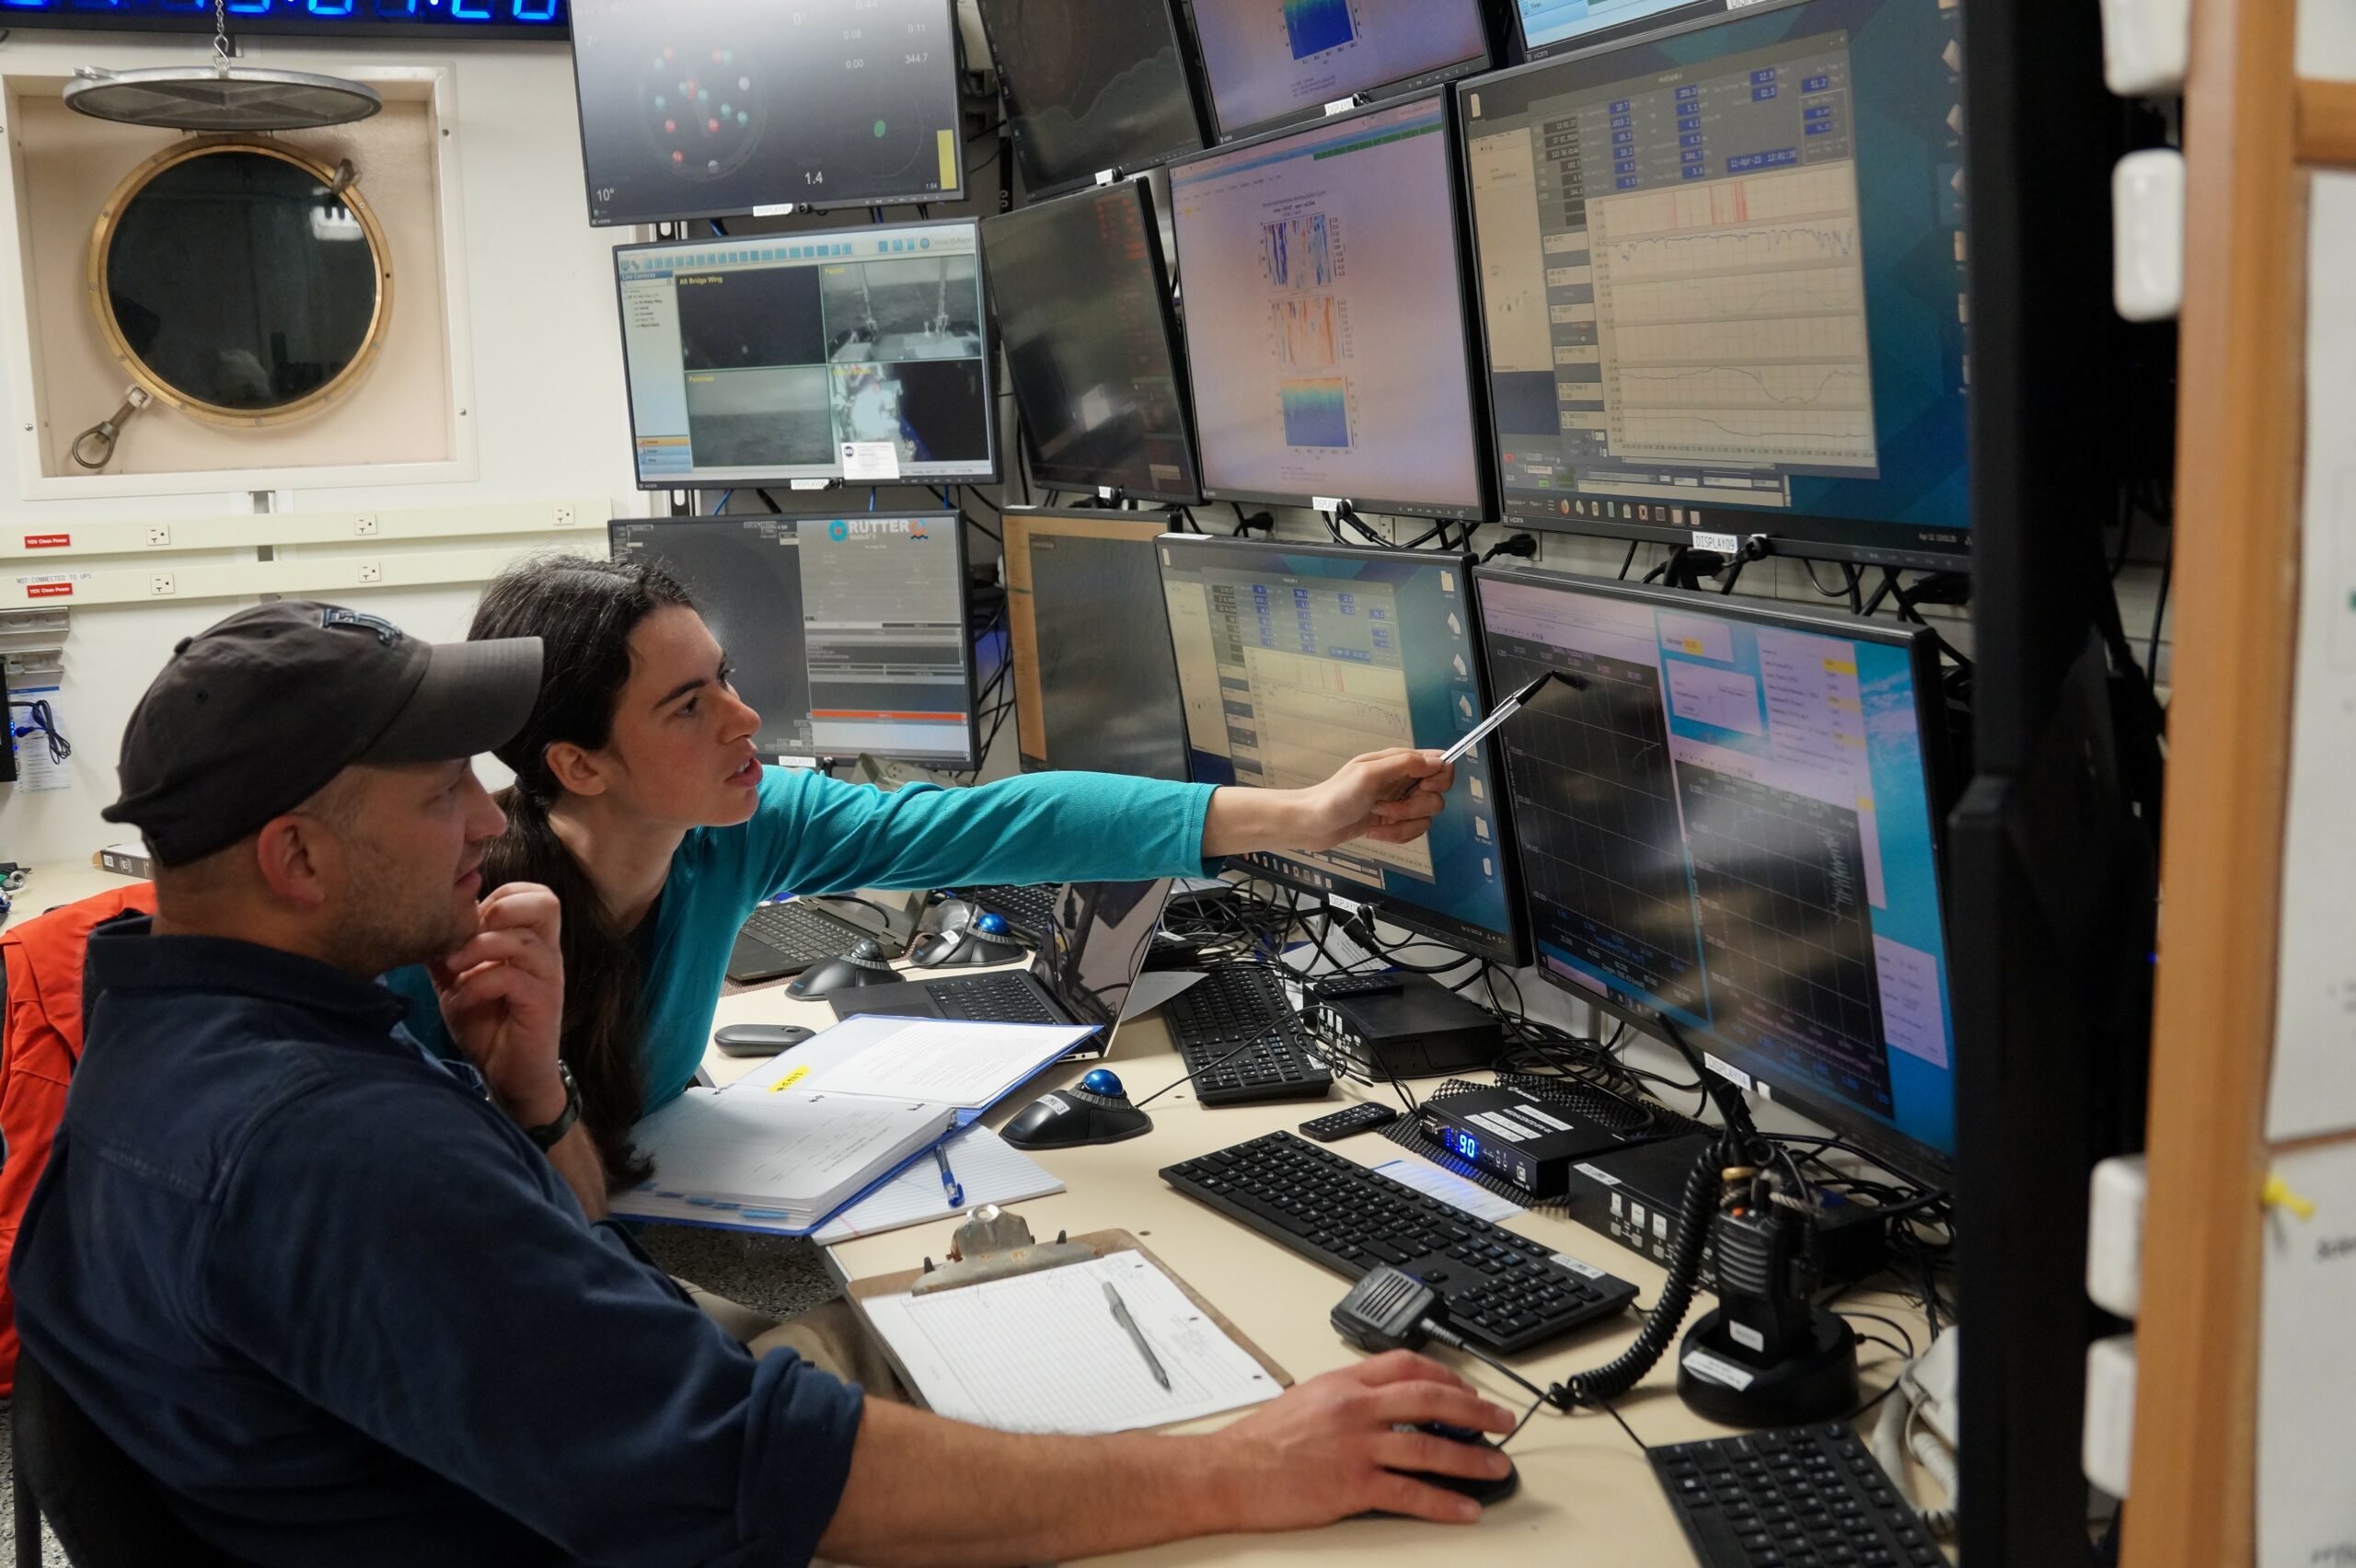
Early morning: I woke up at 2:45 am this morning to plan biological sampling. We aimed to do a Conductivity, Temperature, and Depth (CTD) cast at 5 am. A CTD cast involves lowering a scientific instrument through the water that measures a range of physical and biological variables and that can close bottles to bring water from depth onto the ship. When I woke up, I learned that overnight, Sarah had spotted a submesoscale eddy  in the observations. I looked at the new data and agreed that this was exactly the type of ocean current we had been looking for and charted a course to cross through it again. Once I had the plan, I sent waypoints to the captain and mates who drive the ship. Elise, Kelly, Dante and I started sampling surface water to study the biological communities there. When we got the location that we had planned for a CTD cast, we sampled water from the cast and started a 24-hour experiment to measure growth and grazing rates. This allows us to investigate the role of ocean physics and community composition on ocean food webs. We finished processing the samples just in time for a breakfast of croissant and eggs.

Woman in teal shirt conducts Conductivity, Temperature, and Depth, or CTD, cast to preserve marine samples.
Mara Freilich preserving samples from the CTD cast. Credit: Kelly Luis

Late morning: After a quick nap, I did some data analysis. We are constantly collecting and analyzing data to figure out next steps. Right after lunch (vegetable soup and cheese bread), there was a fire drill. There is a drill every week to keep the scientists and crew in practice in case of a real emergency.

Two researchers sit in front of 12 computer screens, reading a display of data. The computer monitors are aboard a research vessel, with a port hole window in the background.
Pat Kelly and Mara Freilich operating the CTD and choosing where to collect water. Credit: Kelly Luis

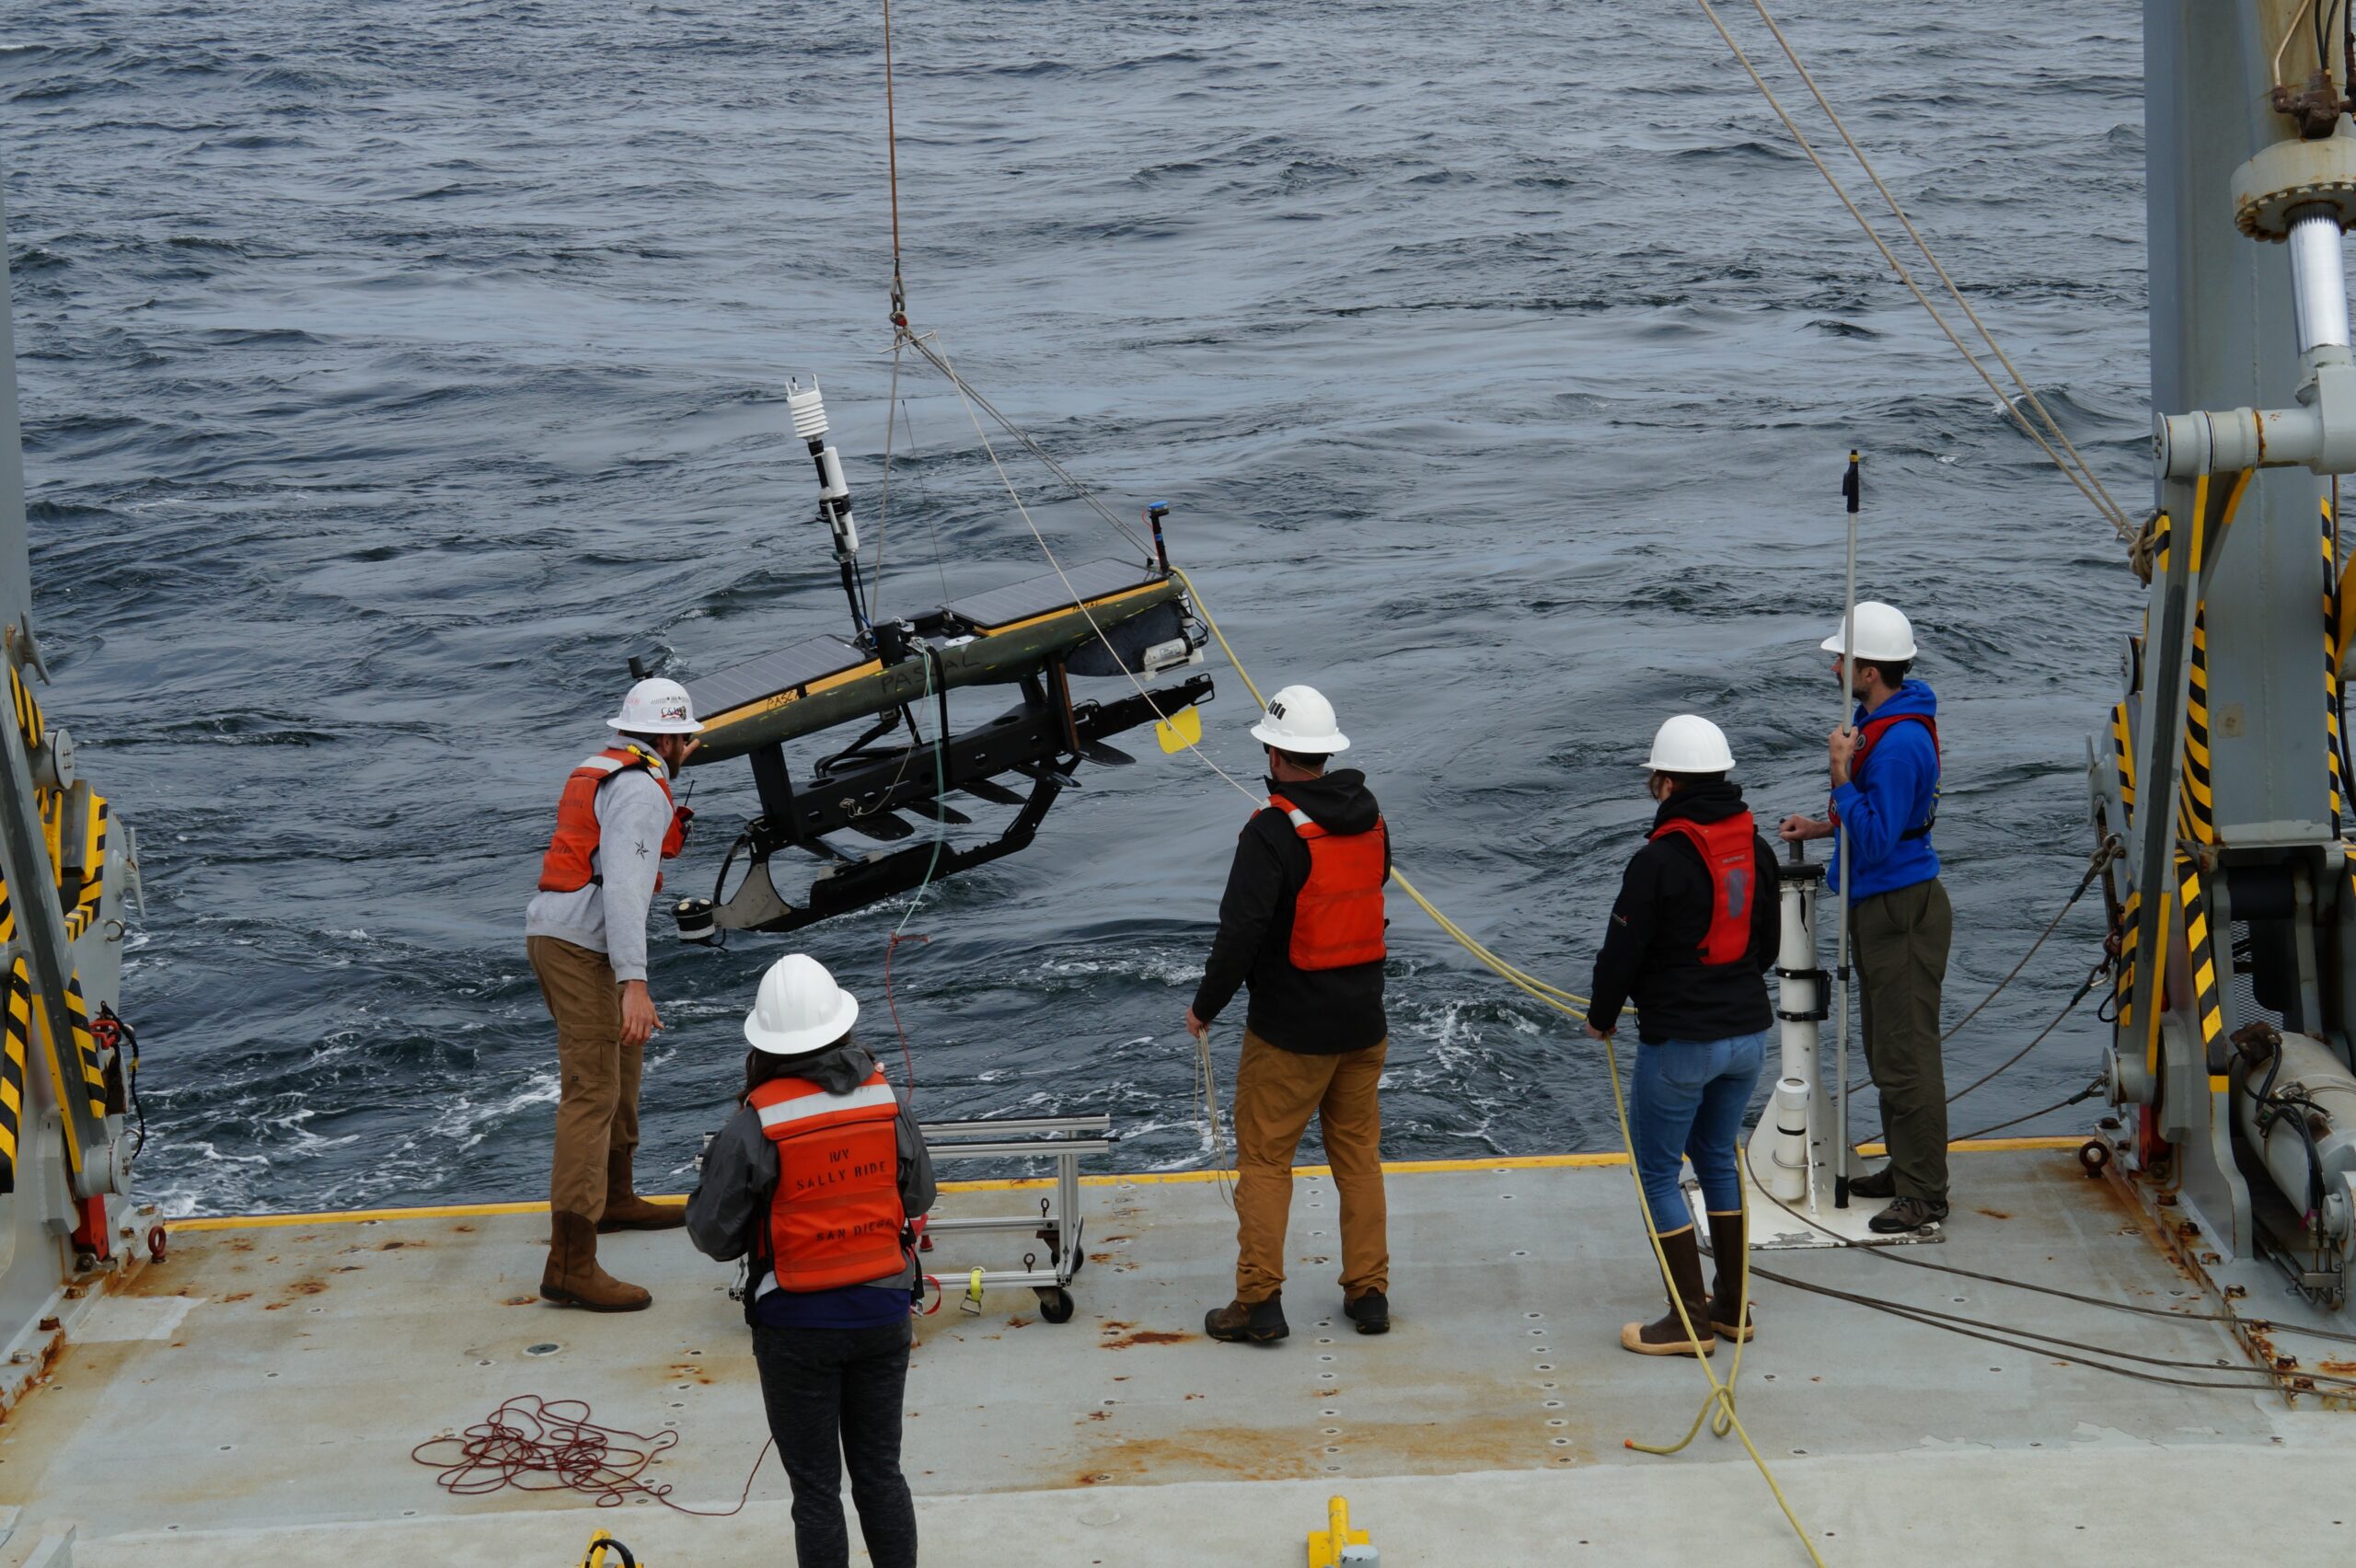
Afternoon: This afternoon we deployed nine autonomous vehicles from the ship. Autonomous vehicles are ocean robots that sample alongside us to give more information. While outside doing this, we saw a whale and took a moment to watch as it swam near the ship!

A group of researchers, equipped with hard hats and life vests, pull at ropes to assist the S-MODE waveglider lower into the ocean.
Members of the S-MODE mission deploying a waveglider, a type of autonomous ocean vehicle. Credit: Kelly Luis

We also had a Zoom meeting with the whole project team, including the pilots for the autonomous vehicles who work from land, scientists working with instruments on planes that fly over the experiment area every day, and scientists involved in the project in other ways, including numerical modeling. We all discussed our interpretations of what we were seeing and the plan for the next 24 hours.

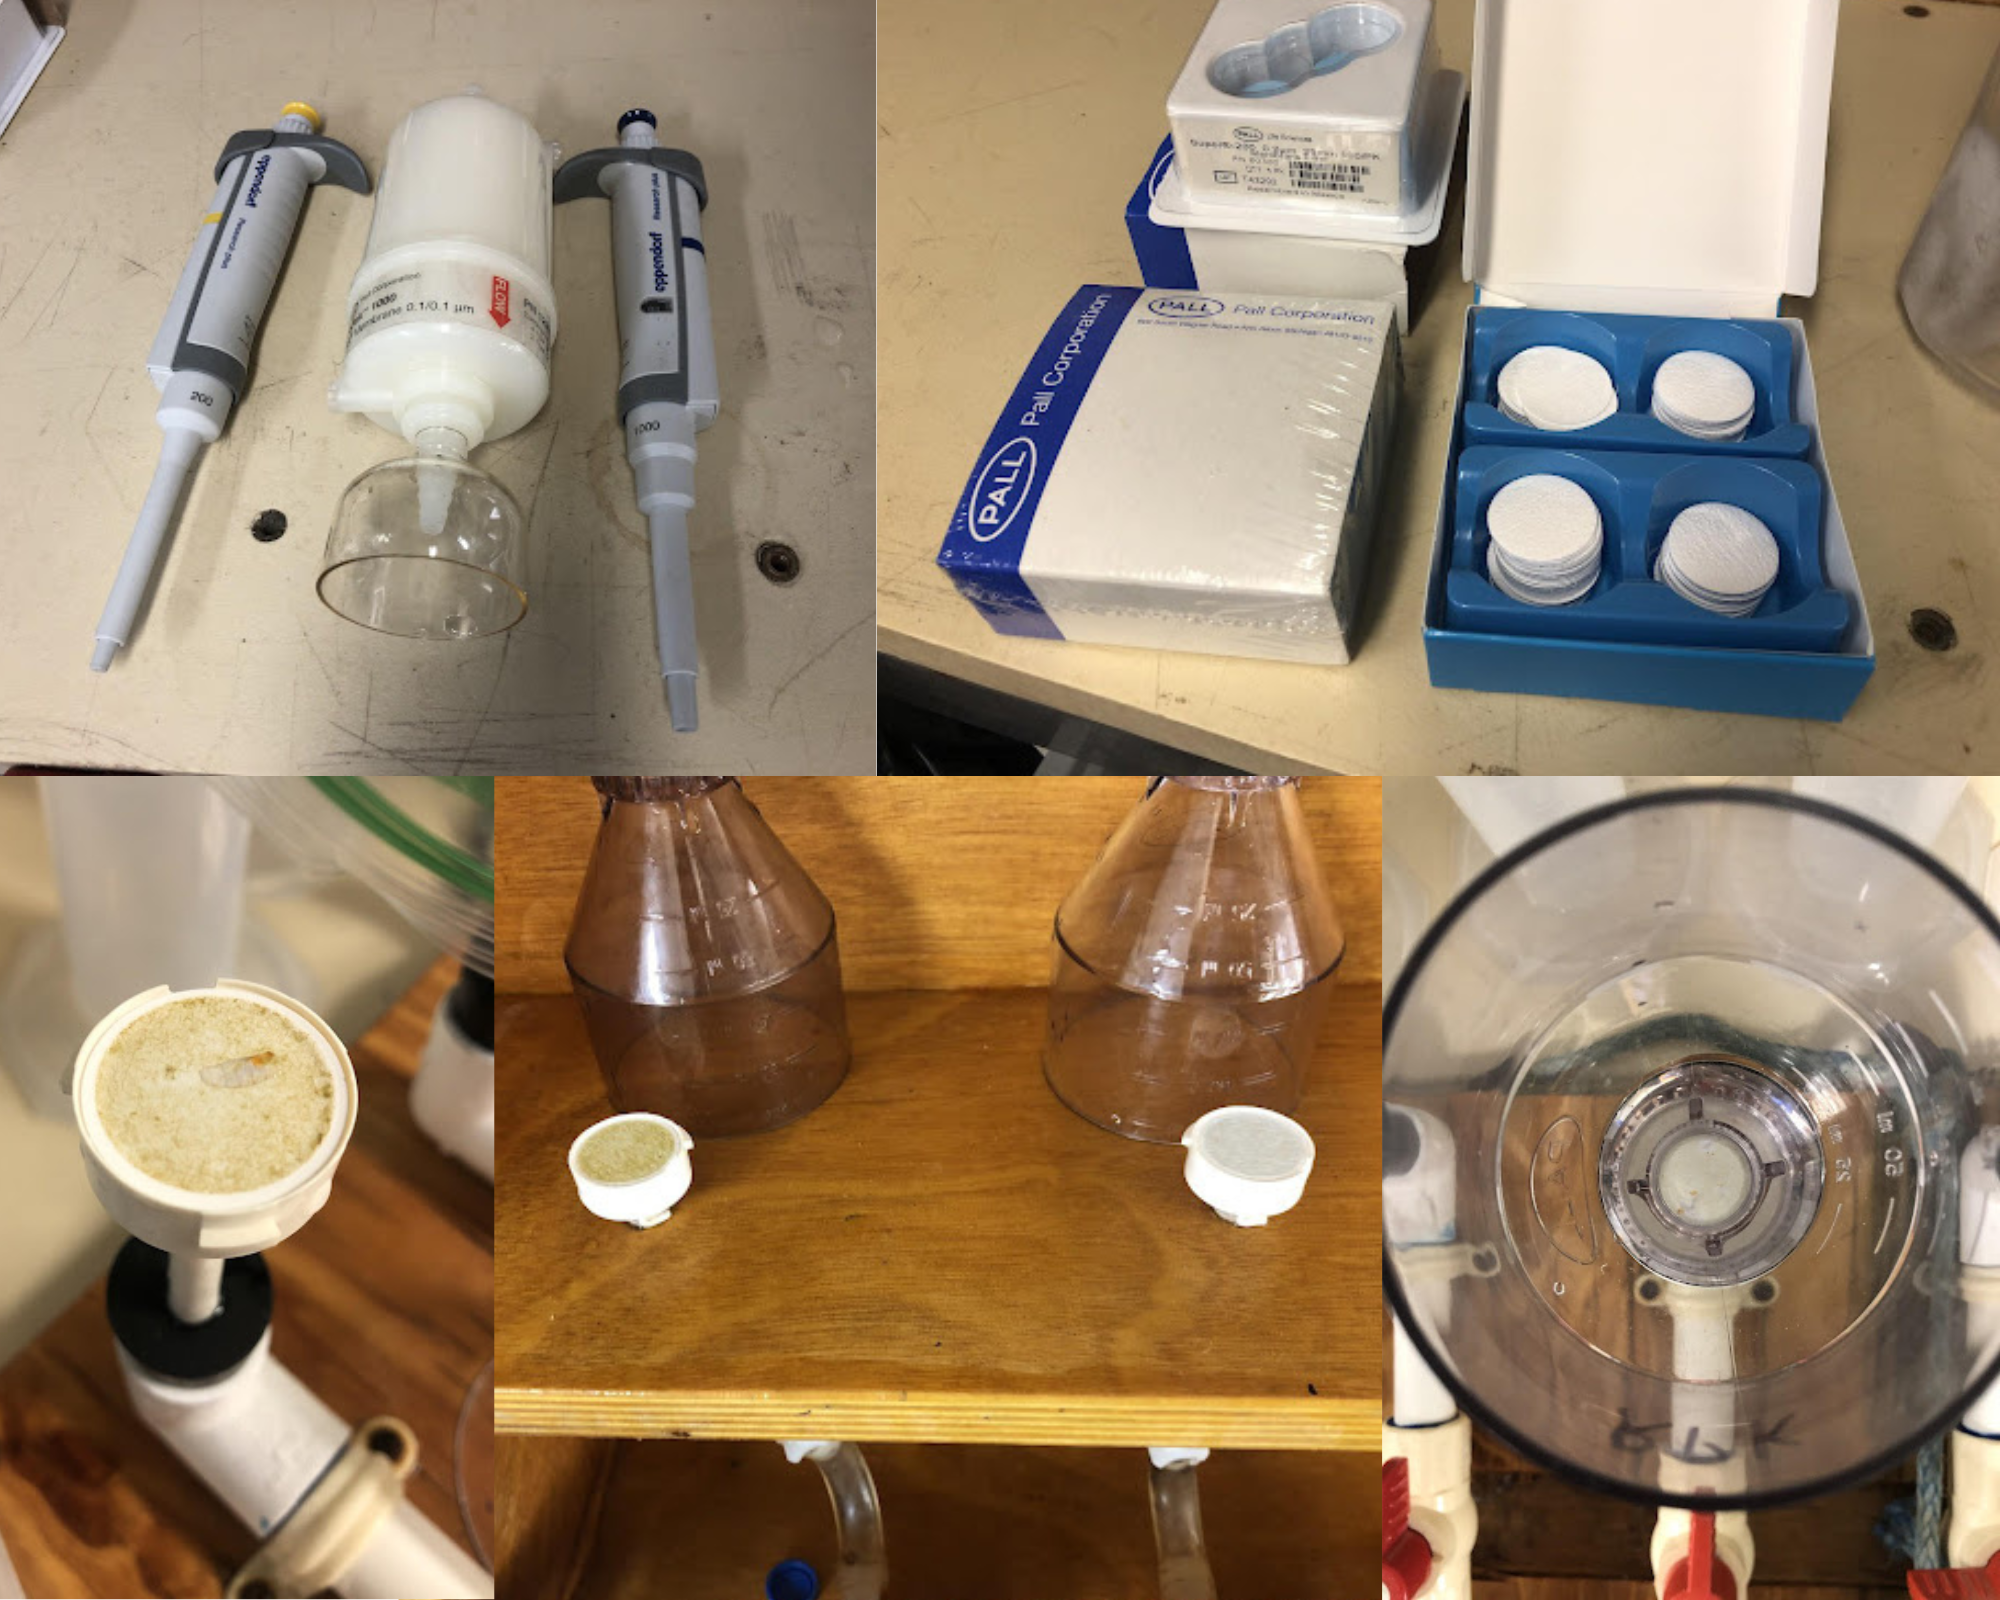
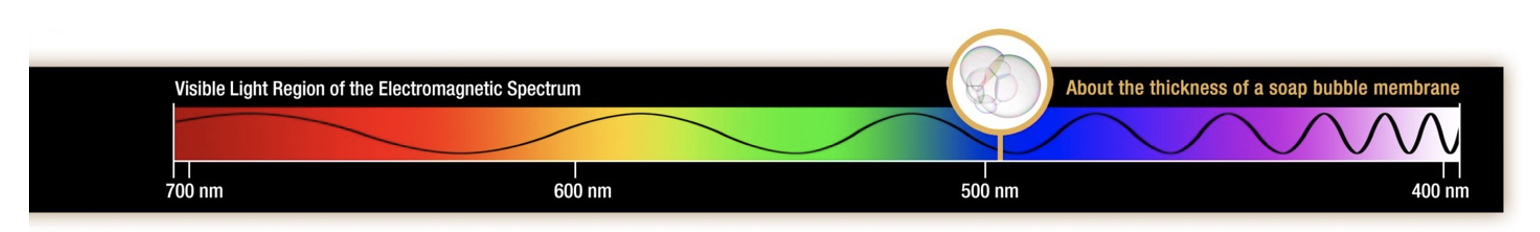
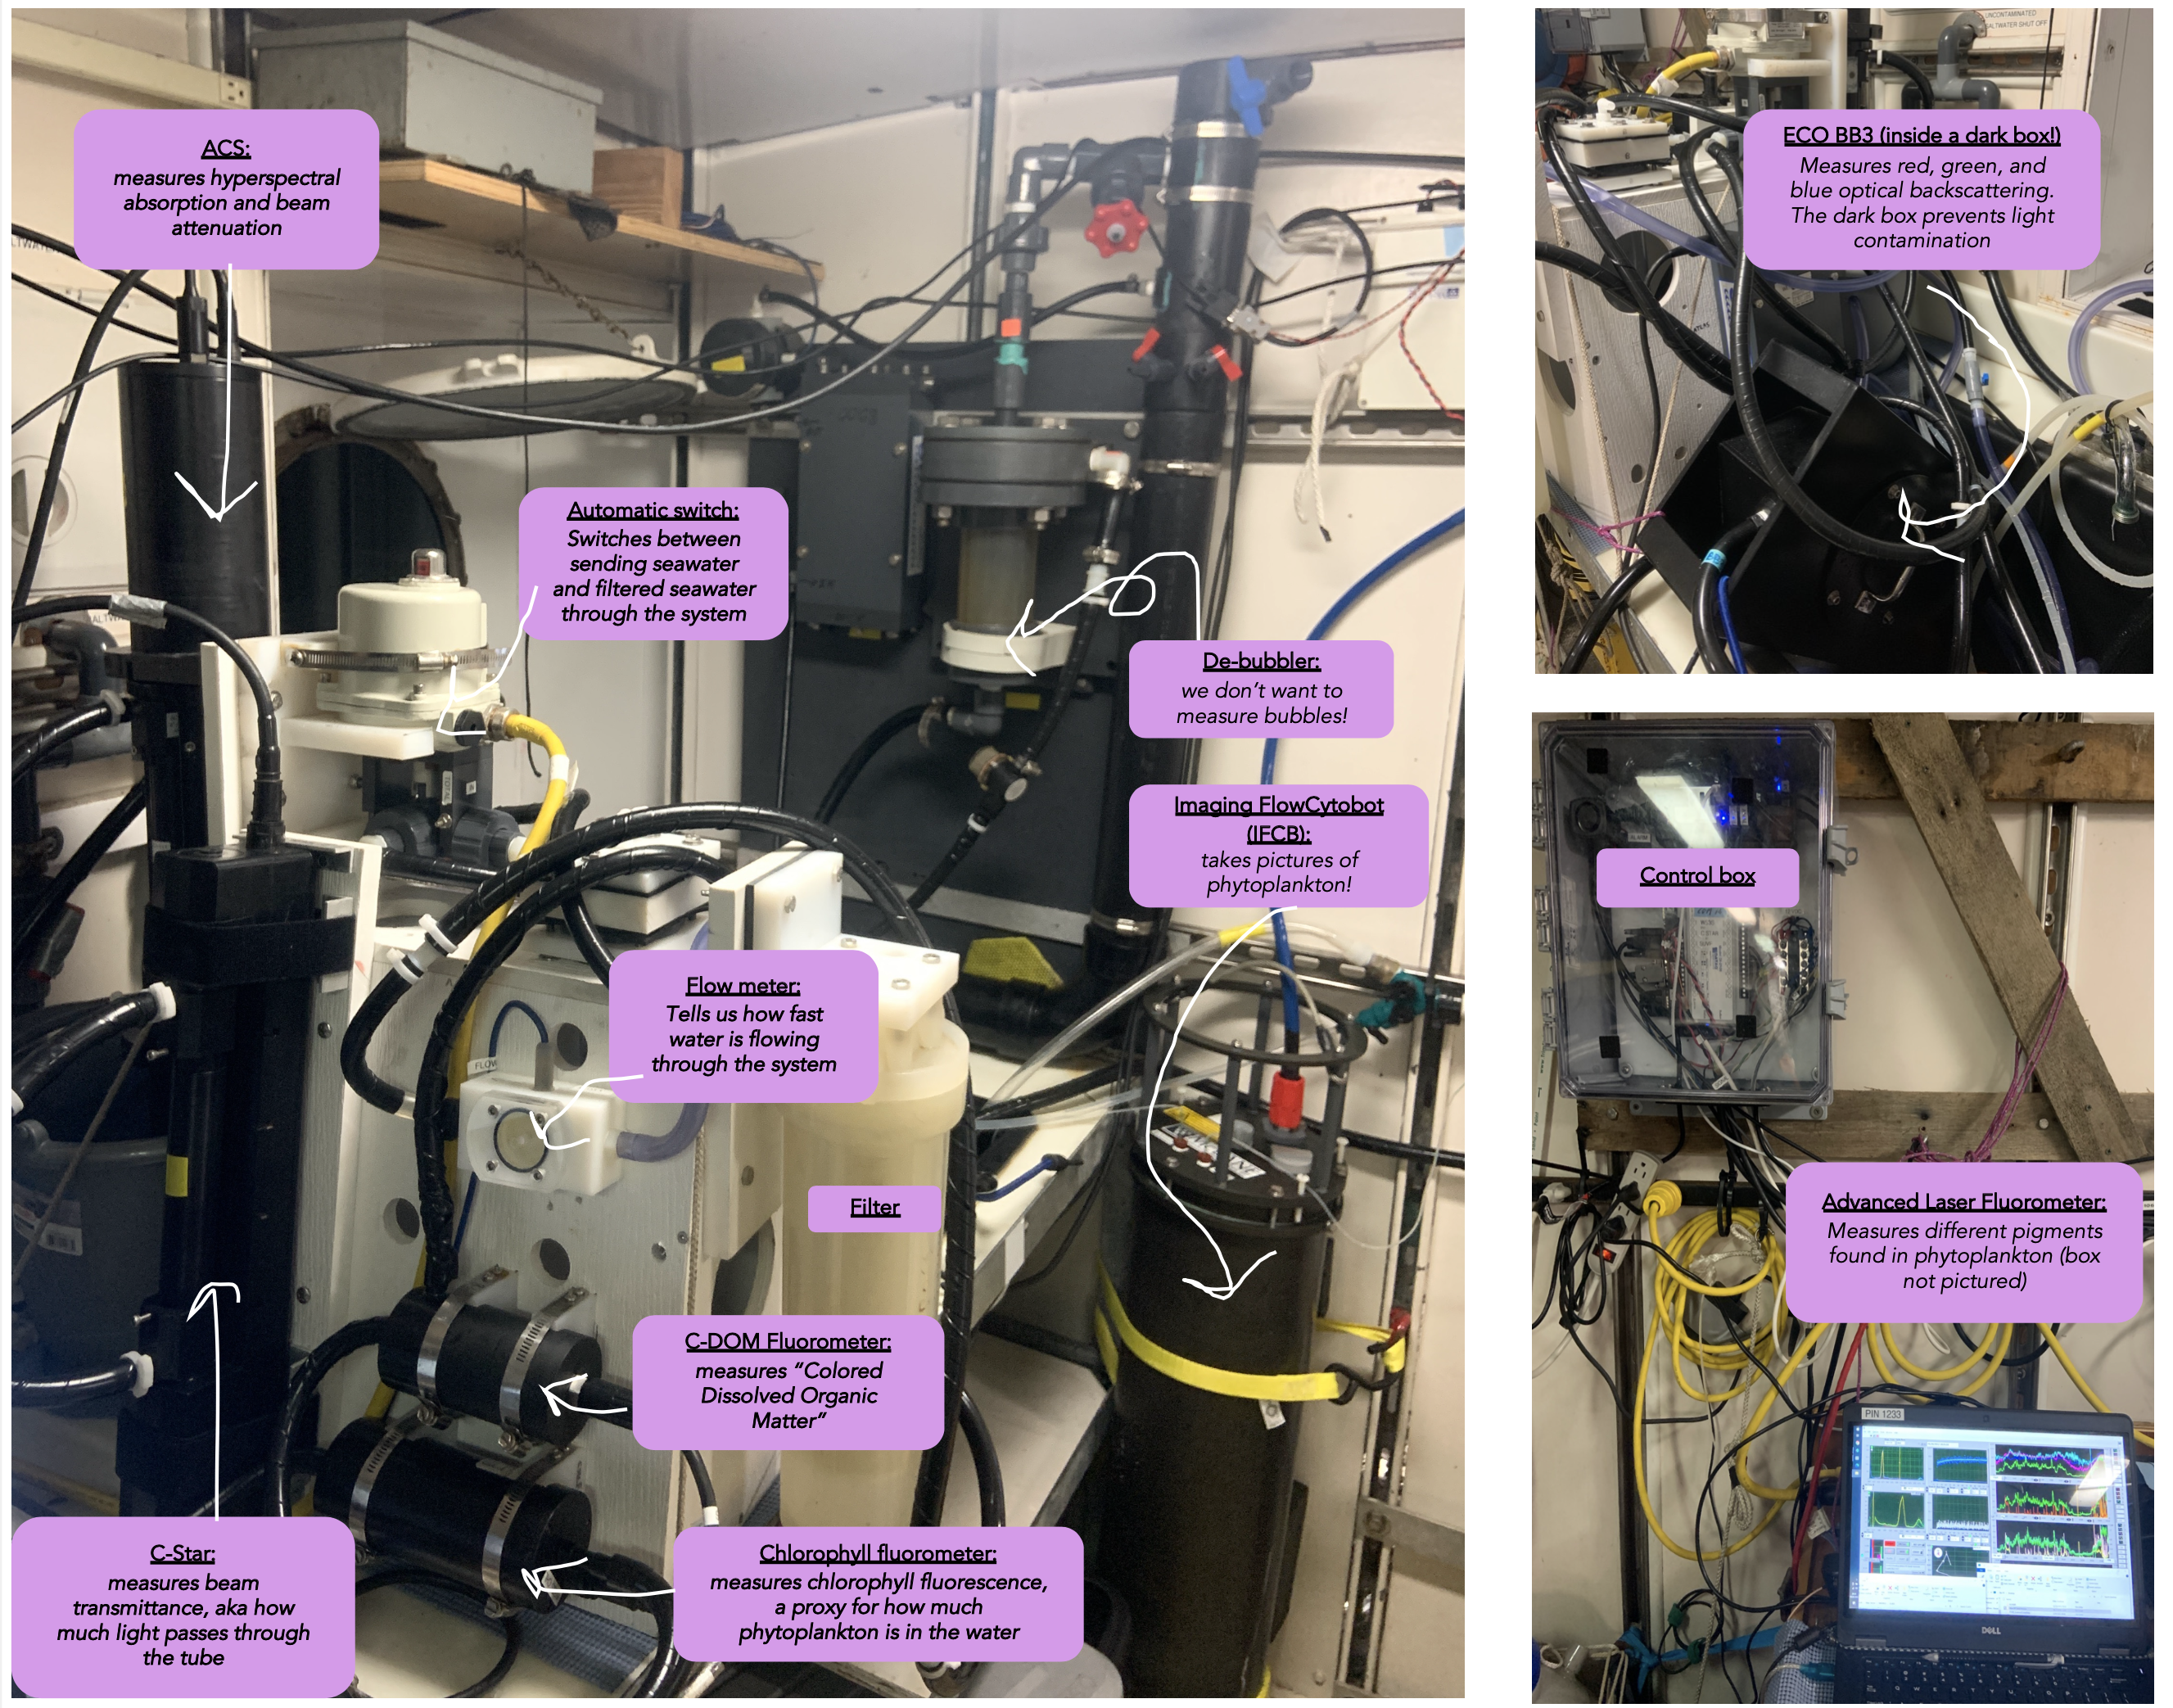
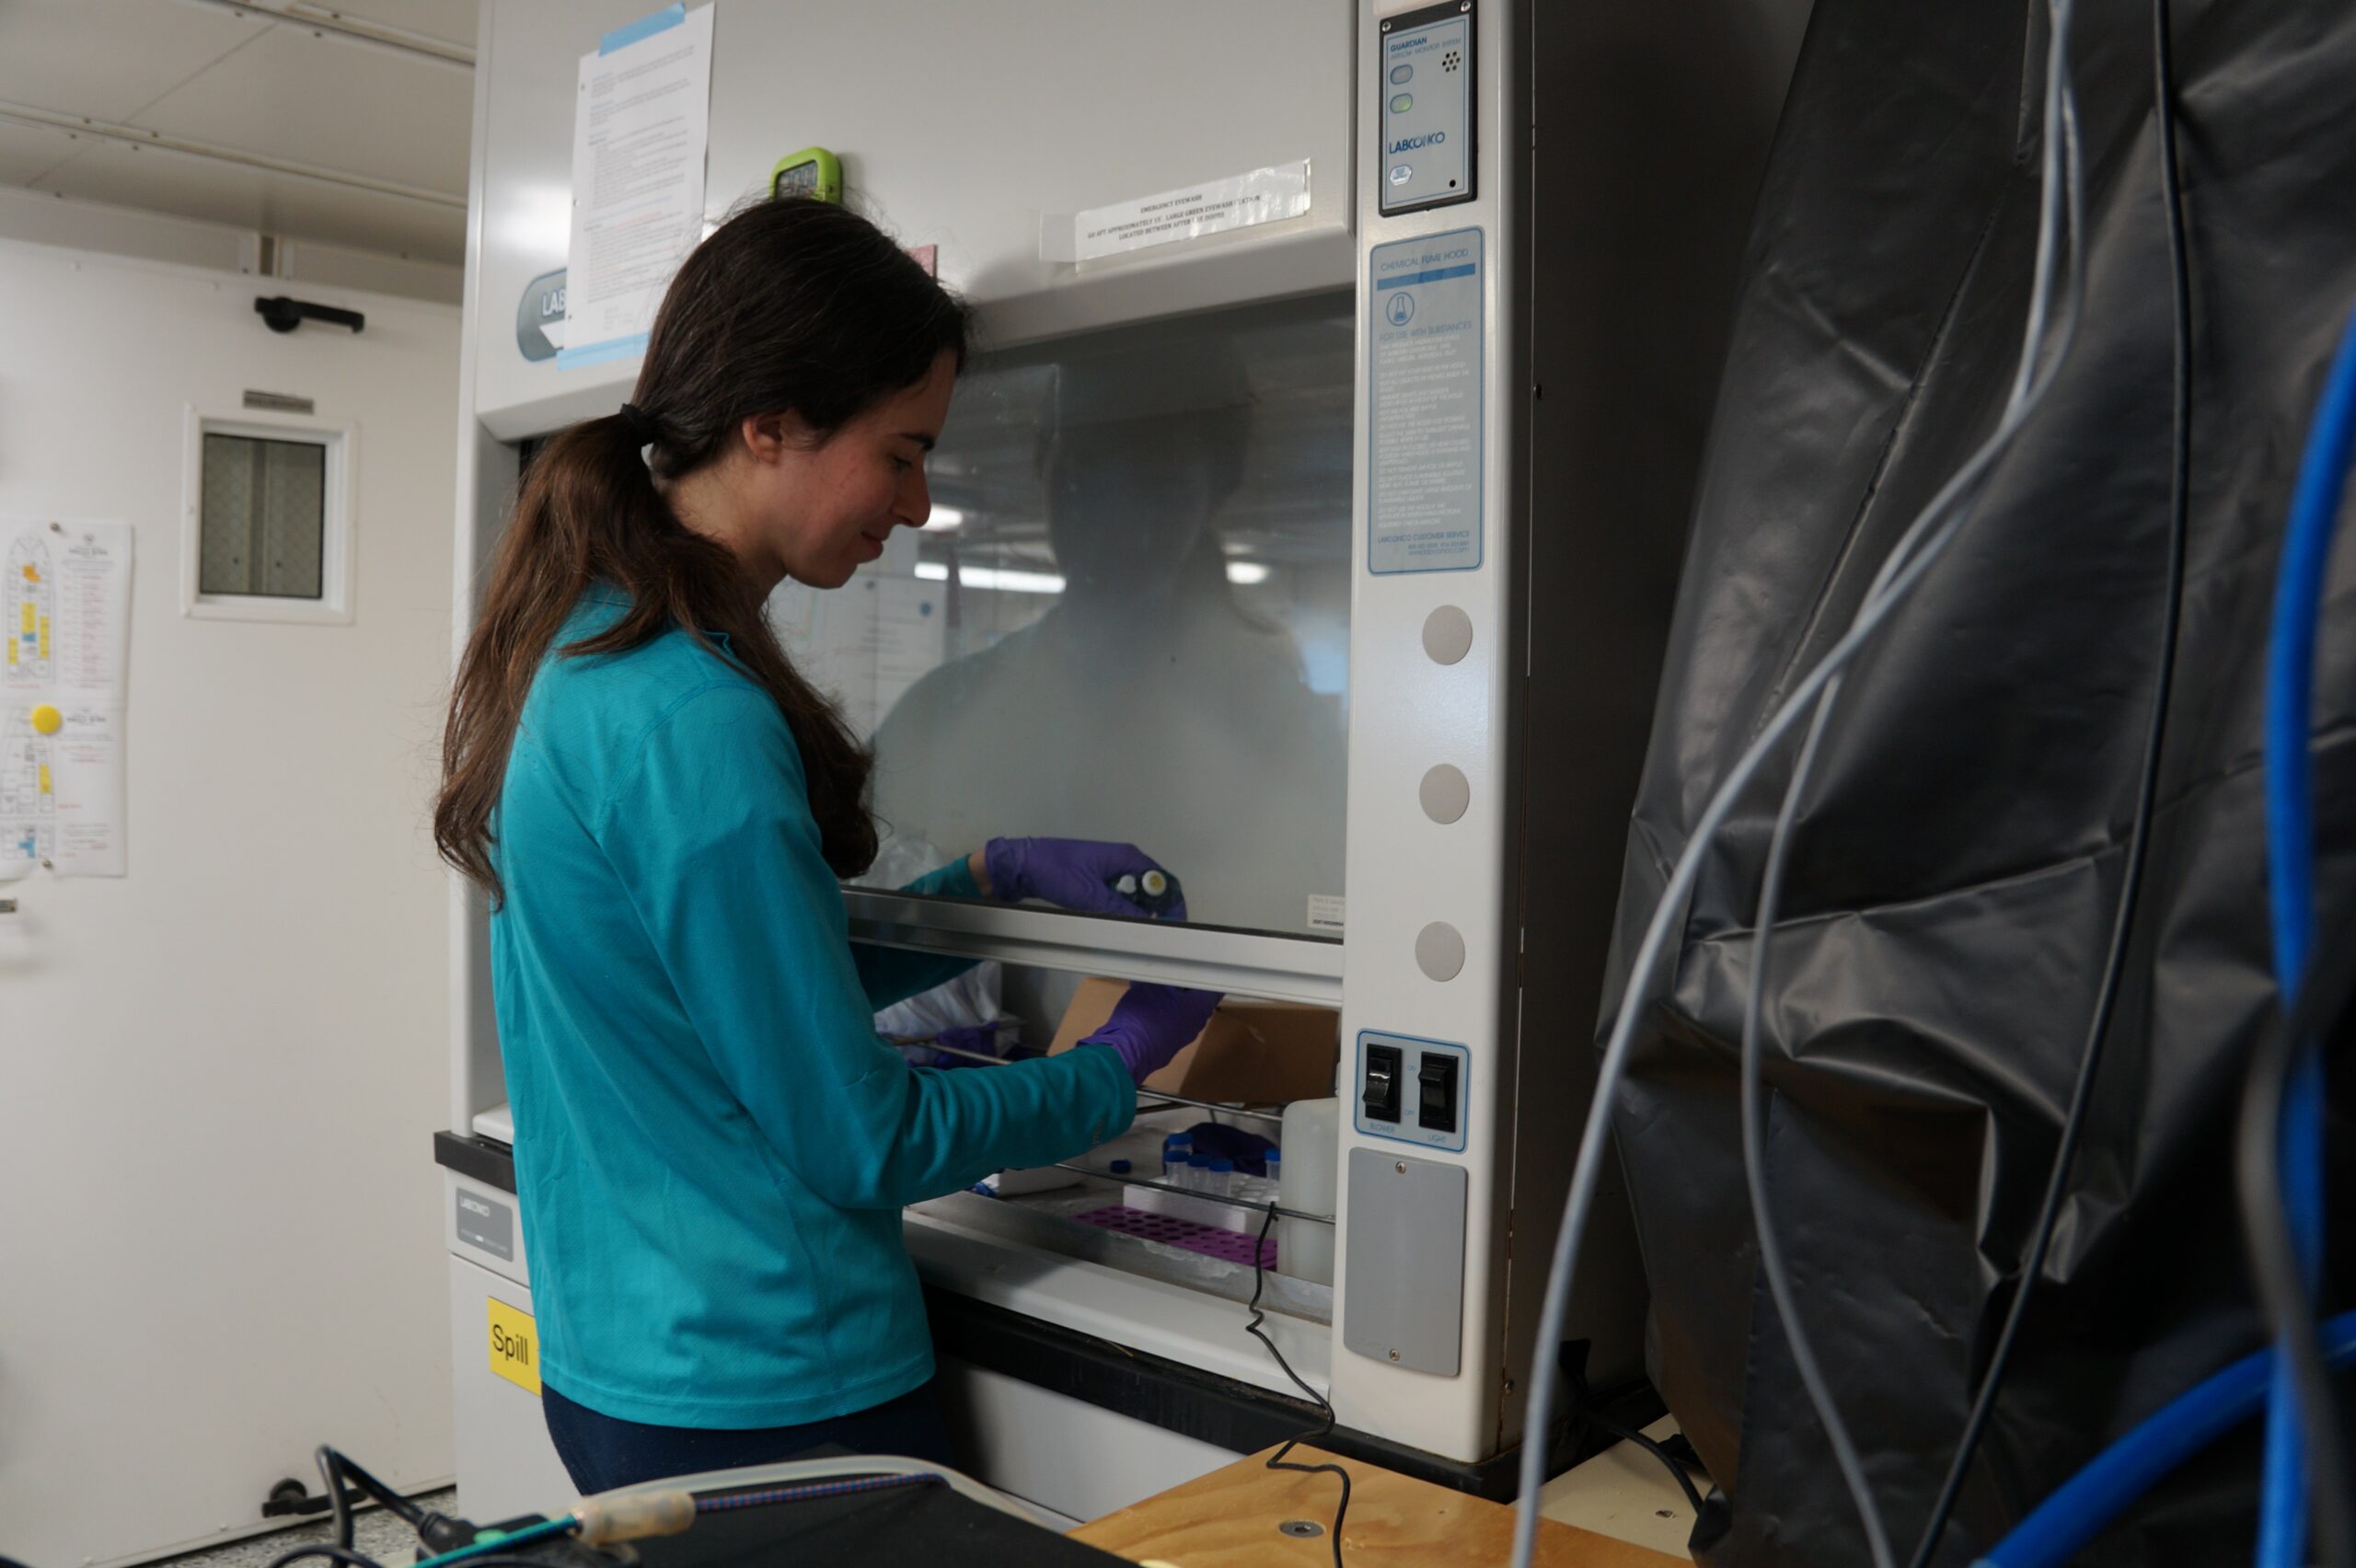
Evening: After dinner, I helped Sarah calibrate one of the instruments that measures the way that light passes through water, called an AC-S (Spectral Absorption and Attenuation Sensor). This instrument tells us about the biological communities in the water, which absorb and scatter light. (Think about a pond with lots of algae that turns green). While the instruments collect data continuously, we have to maintain them to get good quality data. I took a shower and went to sleep after a productive day. Our cabins are on the deck above the spaces where we work and eat. I share my cabin with Kelly. We have bunk beds. Before going to sleep, I made a plan for tomorrow, but of course it might change depending on how the ocean currents change overnight!

Elation Through Filtration: An Oceanographer’s Sensations at Sea

By Dante Capone, Ph.D. student at the Scripps Institution of Oceanography // ABOARD THE SALLY RIDE //

Being a biological oceanographer on a physical oceanographic voyage has highlighted a key distinction between the two disciplines.

Physical oceanographers rely on sensing – deploying instrumentation that measures properties of the water: temperature, velocity, oxygen, etc. Those data are sent back to laptops allowing for near instantaneous analysis. The day-to-day work of biological oceanography, on the other hand, may be a science best described by filtering – a task that is intertwined with most measurements in our field. We collect water and remove the particles or organisms we want to study. The finest filter might have holes that let only the tiniest particles through, while the largest filter could be something like a large net, where even fish can slip through its mesh.

On the surface, this seems to have drawbacks: the science requires elaborate (but often aesthetic) filtration racks and intensive labor both on the ship and back on shore. It may be months before samples are fully analyzed and in a nicely formatted data table on your computer. However, for me these additional steps have resulted in a greater appreciation for the science and a deeper natural intuition for the water we study.

Different interpretations of the filtration rack aboard the R/V Sally Ride
Different interpretations of the filtration rack aboard the R/V Sally Ride. Credit: Dante Capone

Filtering concentrates the colors and shapes of the particles and plankton in the water, painting them on the canvas of a small, white 25mm lens into the water below us. When passing through a phytoplankton bloom the filter may stain vibrant shades of green, yellow, or red, and with material thick enough to form plankton layer cake. Occasionally, a stray zooplankton – a jellyfish or small crustacean – may unintentionally wind up on your filter, causing the true marine biology nerds to gather around in excitement in an attempt to identify it. We note everything, pack the filters into neatly labeled vials and archive the evolution of our oceanographic journey for analysis back on land.

Tools for filtration and biological oceanographic activities.
Essential tools for filtration and biological oceanographic activities. Upper left) 200uL and 1000uL pipettes and 0.1um filter pack. Upper right) 25mm diameter Supor and glass-fiber filters. Lower left) Filter with phytoplankton and larger gelatinous salp zooplankton. Lower middle) Filters loaded onto rack. Lower right) View of filter with filter funnel from above. Credit: Dante Capone

Part of the reason I enjoy biological oceanography is the variation provided by alternating between typical work on the computer and in the lab punctuated by intense bouts of fieldwork at sea. Compared to the data analysis or paper reading we do back on land, the “sea brain” switches gears, acclimating to more hands-on work. After a handful of experiments, we’ve dialed in our tasks, placing filters, measuring and pipetting water becoming ingrained into our muscle-memory. This frees up the mind and facilitates conversations and a special kind of bonding that can only happen due to the lengthy nature of our sampling.

On the S-MODE campaign, I have been doing a lot of filtering. In my case, I’m interested in measuring grazing in the ocean. Analogous to cattle grazing grass on land, zooplankton graze phytoplankton in the ocean and convert this into energy for larger organisms, or export it to the seafloor as fecal pellets. To make my measurements, I join the party of scientists to gather around the CTD (a suite of sampling instruments) where I collect and filter water into countless labeled bottles to remove any microorganisms. Whether there are waves crashing onto the deck or sun shining on a calm sea, the excitement of science spikes our energy, allowing us to share laughter and meaningful conversation. Back in the ship’s lab we’ll carefully pour our water onto dozens of filters, often powered by lively music.

Scenes from CTD water collection party
Scenes from CTD water collection party. Courtesy of Jessica Caggiano and Jacob Wenegrat.

There may come a day soon when biological oceanography advances to the point of instantaneous measurements. Already, high-tech cameras, acoustics, optics, and even early in-situ DNA measurements pave the way to phase out filtration. However, for now we will continue to enjoy the opportunity to slow down and enjoy letting each parcel of water we collect pass through our hands.

NASA’s S-MODE Mission: “Sea-ing” through Rainbow-Colored Glasses

By Sarah Lang, Ph.D. student at the Graduate School of Oceanography, University of Rhode Island. // Aboard the Bold Horizon //

If you asked a random person about the color of the ocean, they would probably tell you that it’s some shade of blue or green. But perhaps that shade of blue looks slightly different to you than it does to the random stranger you’re bothering about the color of the ocean.

The way you see color depends on many things: the way an object interacts with incoming light, the color of that incoming light, and even the way your eyes perceive that light. The stranger likely has cone cells in their eyes that perceive light differently than yours.

When light from the sun enters the ocean, it is scattered or absorbed by phytoplankton (microscopic organisms in the ocean that produce oxygen, take up carbon dioxide, and serve as the base of the marine food web), organic matter, minerals, and other constituents in the water, as well as the water itself.

These interactions affect different wavelengths of light differently. Remember the electromagnetic spectrum? Let’s think of colors as different wavelengths of light.

Graphic of visible light portion of the electromagnetic spectrum, with red (longer) on left and white (shorter) at right.
The visible region of the electromagnetic spectrum. Credit: NASA

If we can quantify how light scatters and absorbs after entering the water, we can gain a better understanding of what is in the water. This includes not only how much phytoplankton, but what species there are! This is important for better understanding the ocean’s carbon cycle. Different species of phytoplankton contribute to the ocean’s carbon cycle in different ways (eg., phytoplankton size influences how much carbon they fix), so it is important to understand their distributions.

I am a Ph.D. student at the University of Rhode Island’s Graduate School of Oceanography. I’m interested in how the physics of small-scale features in the ocean affect phytoplankton ecosystems, and I work with ocean color to better understand the biogeochemistry and ecology of the ocean.

Photo of me filtering seawater samples for particulate organic carbon (POC). Courtesy of Kelly Luis.

During the S-MODE campaign, we are using ocean color to capture small-scale variability in phytoplankton species and physiology (how happy are the phytoplankton?).

Here’s how we do it: we take many, MANY seawater samples (we took over 300!) and we analyze these samples for chlorophyll (tells us about how much phytoplankton are in the water), particulate organic carbon, pigments (what types of phytoplankton might be there?), and nutrients.

Mackenzie Blanusa and I tag-lining a CTD-Rosette as it is lowered into the water to collect seawater samples at depth. Photo courtesy of Pat Kelly.
Pat Kelly and I holding our URI-GSO flag in front of the CTD-Rosette. Photo courtesy of Pat Kelly.

We use these samples to “calibrate” ocean color (aka bio-optical) measurements. One way we take these bio-optical measurements is from a flow-through system. We send water through a series of optical instruments that measure different optical properties of the water. Basically, we want to turn continuous optical measurements taken on the ship into biological parameters we understand (like phytoplankton!).

 
Photos of optical flow-through system. Water flows through the system and is measured by each instrument in succession. The switch will automatically switch between filtered water and total seawater so we have measurements of the dissolved constituents of the seawater and the particulate constituents of the seawater. Beam attenuation describes how much light from a beam is lost when it travels through the water. Backscattering describes how much light is scattered in the backwards direction. All these “optical measurements” are useful in describing the biogeochemistry of the water. For example, beam attenuation can vary with the amount of particulate organic carbon in the ocean. Backscatter can be used as a proxy of particle size. Most instruments are borrowed from Emmanuel Boss’s lab at the University of Maine. Advanced Laser Fluorometer from SIO. IFCB from URI.

Then, we can use these bio-optical measurements to validate measurements from AIRPLANES! These planes (NASA PRISM: Portable Remote Imaging Spectrometer and SIO MASS: Modular Aerial Sensing System) have hyperspectral sensors on them measuring how much light is leaving the water at different wavelengths.

Hyperspectral sensors are really cool because instead of knowing how much light is leaving the water at a few wavelengths across the visible spectrum, we can capture continuous information (almost the whole spectra!). Hyperspectral measurements give us the information we need to estimate phytoplankton species.

Soon, we’ll have global hyperspectral ocean color data for the first time. We’ll be able to see the ocean in a way we’ve never seen before with NASA’s upcoming satellite mission PACE (Phytoplankton, Aerosol, Cloud, and ocean Ecosystem). New discoveries about our amazing planet will follow!

Following the Ocean Fronts

A pink and purple sunrise over the ocean.
Picture of the sky cloud coverage from the Bold Horizon on the morning of October, 17th. Credit: Audrey Delpech.

By Audrey Delpech, postdoc in the Atmospheric and Oceanic Sciences department at UCLA

Being part of the NASA S-MODE oceanographic mission was a great experience for me. It was only my second oceanographic mission and my first one on a US research vessel. I learned a lot about how to use the different instruments, interpret their data and about the complexity of the ocean.

This mission is designed to study submesoscale fronts – which correspond to abrupt changes of water temperature or salinity over scales of about 6 miles or 10 kilometers in the ocean. They act in a similar way as we have fronts in the atmosphere that bring us cold or warm weather, rain or dry air masses. S-MODE is making the first observations that show such fronts do play a role in stabilizing our climate by acting as a connector between the deep ocean and the atmosphere, and controlling the exchanges of quantities such as heat or carbon.

Figure of the sea surface temperature measured along the ship course and the position at which radiosonde were released across a front. Credit: Audrey Delpech.
Figure of the sea surface temperature measured along the ship course and the position at which radiosonde were released across a front.
Credit: Audrey Delpech.

Because these fronts move and change throughout the day, we didn’t have a set sampling plan. Instead, we would look at the real-time conditions so we could figure out where to go and how to get the best measurements from the ship and three aircrafts. This is called “adaptative sampling.”

My research has lately evolved towards understanding how the ocean interacts with the atmosphere above. I have been working with models to simulate and study how submesoscale ocean motions interact and exchange energy with the winds. Onboard the ship I worked with an instrument called a radiosonde. Radiosondes are sensors which are attached to a balloon and  measure temperature, humidity, wind speed and direction as they rise up in the air. I’m interested in seeing how the temperature of the ocean across these fronts influences the wind speed of the air above. We released radiosondes at regular time intervals as the ship was moving across fronts. These measurements will hopefully confirm the findings from the numerical models, and I am really looking forward to analyze them.

A woman stands at the rail of a boat, ocean in the background. Her hands are up as they have just let go of a balloon with a white instrument the size of a cup dangling from it.
Radiosonde launch. Credit: Audrey Delpech.

Another important part of my work onboard was to provide real-time weather conditions from the ship. The onshore team used my reports every day to make the decision of whether to fly the aircraft or not, or if they needed to adapt their survey region. Some airborne instruments required clear-sky conditions or high enough clouds so they could fly in the clear underneath. The radiosondes measurements helped me figure out how high and how thick the clouds were, two important parameters to characterize the cloud coverage.

A graph that shows the altitude on the y-axis and a line showing relative humidity lowering as it goes higher and a second line showing temperature decreasing as it goes higher. A bar indicates the cloud layer from 1 kilometer to 1.5 kilometers above the ocean surface.
Temperature and humidity profile measured by the radiosonde. The saturation (100%) relative humidity layer indicates the cloud layer. Credit: Audrey Delpech

I also collected radiosondes’ atmospheric temperature and humidity profiles from the sea surface to about 8 km height at the same time the airplanes were flying overhead. These data will help calibrate the airborne infrared remote sensors.

Besides the weather reports, I also took part in many other operations. One was helping to deploy an instrument called a CTD (for Conductivity, Temperature and Depth). This instrument measures the temperature and salinity of the sweater as a function of depth as the ship is moving across the ocean. This helped us understand the vertical extension of the front in the subsurface ocean (from 0 to about 200m deep). I also helped filter water samples for future onshore DNA analyses, which will give a sense of the diversity of microscopic phytoplankton across submesoscale fronts, deployed and recovered Lagrangian floats, which are designed to drift with currents, helped navigate the ship to chase fronts, and helped with the real-time processing of data.

Two people stand to either side of a about five-foot tall cylindrical instrument they are prepareing to put in the water.
Audrey Delpech, Dipanjan Chaudhuri and Avery Snyder preparing a Lagrangian float deployment operation. (photo credit: Gwendal Marechal)

This experience has taught me a lot about the challenges of “adaptative sampling” and made me think differently about the value of the data collected. I now know the amount of coordination and labor that are behind them.

It was also a wonderful human experience. The community of people we were forming on this cruise was very diverse, with everyone coming from a different horizon. Several nationalities were represented and each person I met has brightened up my experience at sea. I have made some really good friends and met wonderful scientists I am looking forward to collaborate with in the future.


Life at Sea: Books of the Bold Horizon

By Kelly Luis, NASA Postdoctoral Program Fellow at the Jet Propulsion Laboratory, California Institute of Technology // Aboard the Bold Horizon //

ʻAʻohe o kahi nana o luna o ka pali; iho mai a lalo nei; ʻike ke au nui ke au iki, hea lo a he alo. The top of the cliff isn’t the place to look at us; come down here and learn of the big and little currents, face to face (Pukui, 1983, 24).

I brought Sweat and Salt Water: Selected Works by Dr. Teresia Kieuea Teaiwa onboard the R/V Bold Horizon. The book was the last addition to my bag before heading to the airport. I’m not sure why I threw the book in my bag; but I was even more puzzled when I realized late into the cruise, I read Chapter 5: Lo(o)sing the Edge every time I opened the book. Maybe it was the relevance of Dr. Teaiwa’s inclusion of the ʻōlelo noʻeau (Hawaiian proverb) to S-MODE or maybe the navigation of her professional and personal life resonated with my experience navigating aquatic remote sensing as a kānaka maoli (Native Hawaiian) woman. Still in question as the vessel began its final transit to San Diego, I went on a quest to learn about the books brought aboard.

Kelly Luis reading Sweat and Salt Water in the lab. Credit: Kelly Luis

Tucked between the laptops, bungee cords, and camera bags, I first noticed Sarah Lang’s autographed copy of This is How You Lose the Time War by Amal El-Mohtar & Max Gladstone. Between late night CTD transects and long days of filtering during plane overpasses, Sarah Lang quickly finished up The Seven Husbands of Evelyn Hugo by Taylor Jenkins Reid and just started her second book.

Sarah Lang’s autographed copy of This is How You Lose the Time War. Credit: Kelly Luis

When Andy Jessup returns to his bunk after radiosonde launches and saildrone chasing, he immerses himself in fiction, which he later donates to the ship’s library. Jessica Kozik’s exuberance for the sea carries over into her reading. She is three chapters into Blue Mind: The Surprising Science That Shows How Being Near, In, On, or Under Water Can Make You Happier, Healthier, More Connected, and Better at What You Do by Wallace J. Nichols on her Kindle. Balancing graduate coursework in between ecoCTD shifts, Mackenzie Blanusa can be found in the galley with books for her classes.  Audrey Delpech started L’art de perdre by Alice Zeniter on land and tries to sneak in reading time between radiosondes, ecoCTD watches, and assisting with biological sampling. When Pat Kelly isn’t reading fluorescence samples and macgyvering sensors on the CTD, he’s resting up with classics like Sweet Thursday by John Steinbeck and horror thrillers like Pet Sematary by Stephen King.

Andy Jessup’s donation to the ship’s library. Credit: Kelly Luis.

Not everyone brought a book and/ or knew not to bring a book because of our workload. Our chief scientist is a prime example. Up at every hour he can be, Andrey oversees all science operations, determines boat headings in relation to changing fronts and eddies, and still makes it on deck for all Lagrangian float, waveglider, and seaglider recoveries. He did share that on a previous cruise he brought Gödel, Escher, Bach: an Eternal Golden Braid by Douglas Hofstader, a mathematics book he enjoys reading with the shifting sea state. Ben Hodges did not bring a book because he knew he would be busy leading ecoCTD and waveglider operations, but he wished he brought The Ashley Book of Knots by Clifford Ashley to assist with his night watch knot tying course.

Pat Kelly reading in the library. Credit: Kelly Luis.

From my informal survey, it seemed almost everyone wanted to get more into their books, but were worn-out after watches. From keeping up with operations and learning new instruments, we were naturally tired and the comforts of an easy to get lost in piece of work beat out starting something new. My reading of the same chapter may have simply been a deep desire for familiarity. However, I think it may also relate to our chief scientists’ sentiment toward his mathematics book. The shifting sea state provided new glimpses of the relations between the text and my journey, but also the biological and physical relations we observed on the R/V Bold Horizon. Much more can be said about the edges of existing models’ ability to capture sub-mesoscale processes and the importance of meeting these features face to face. However, this chapter of S-MODE 2022 cruise is coming to end, but another chapter awaits the science party in 2023.

Until we meet the big and little currents again.

Reference:

Mary Kawena Pukui; illustrated by Dietrich Varez. ʻŌlelo Noʻeau: Hawaiian Proverbs & Poetical Sayings. Honolulu, Hawaiʻi: Bishop Museum Press, 1983.

List of Books/Magazines Aboard the Bold Horizon

  • Sweat and Salt Water: Selected Works by Teresia Kieuea Teaiwa
  • Science on a Mission: How Military Funding Shaped What We Know and Don’t Know About the Ocean by Naomi Oreskes
  • Pet Semetary by Stephen King
  • Sweet Thursday by John Steinbeck
  • Three body problem by Liu Cixin
  • L’art de perdre by Alice Zeniter
  • Mermoz by Joseph Kessel
  • Le serpent majuscule by Pierre Lemaitre
  • This is How You Lose the Time War by Amal El-Mohtar & Max Gladstone
  • The Seven Husbands of Evelyn Hugo by Taylor Jenkins Reid
  • Hunter-Gathers Guide to the 21st Century: Evolution and Challenges of Modern Life by Heather Heying and Brett Weinstein
  • The Sentence by Louise Elhrich
  • Blue Mind: The Surprising Science That Shows How Being Near, In, On, or Under Water Can Make You Happier, Healthier, More Connected, and Better at What You Do by Wallace J. Nichols
  • Birds of Southern California: Status and Distribution by Jon L. Dunn and Kimball Garrett
  • The Book: On the Taboo of Knowing Who You Are by Alan Watts
  • The Outermost House by Henry Beston
  • The Flame Throwers by Rachel Kushner
  • Shame of a Nation: The Restoration of Apartheid Schooling in America by Jonathan Kozol
  • Why are all the black kids sitting together in the cafeteria? And Other Conversations About Race by Beverly D. Tatum
  • Essentials of Atmosphere and Ocean Dynamics by Geoffrey K. Vallis
  • Le voyage d’Emma
  • Hermann Hesse by Siddhartha
  • The Orion Magazine
  • High Country News

Surface Waves from the Bold Horizon’s Deck During NASA’s S-MODE Experiments

By Gwendal Marechal, postdoctoral researcher at the Colorado School of Mines // Aboard the Bold Horizon //

Upon leaving the Breton coastlines after my Ph.D., I started a postdoc at the Colorado School of Mines. After one month in the Colorado mountains, I traveled to Newport, Oregon, to board the Bold Horizon for one month of measurements offshore of San-Francisco for the NASA S-MODE (Sub-Mesoscale Ocean Dynamics Experiment) field campaign. This experiment focuses on sub-mesoscale currents (spatial scales smaller than about 30 km, or 18 miles, at these latitudes), and tries to assess how important these structures are for the vertical exchange in the ocean and fluxes between the lower atmosphere and the upper ocean.

We set sail for the experiment area after six days of mobilization in Newport. This is my first cruise that focuses on a different topic than surface gravity waves (waves hereafter). Actually, during this cruise, the (steep) waves were mostly a drawback for the CTD, Eco-CTD casts, and floating/underwater platform (sea-gliders, wave gliders, Saildrones) deployments. These waves were, however, one of the main focuses of the Twin Otter airplane flying above us during the S-MODE experiment. This aircraft and its instrument MASS were flying almost every day throughout the cruise collecting the sea-state properties at very high resolution. In other words, it measured the wave height, direction and wavelength. Also, with its optical sensor, MASS is able to capture the breakers resulting from waves, the famous “sheep” at the ocean surface.

The Twin-Otter aircraft during the S- MODE campaign. Credit: Alex Kinsella

Even if we are not measuring waves directly from the Bold Horizon, some of our floating platforms, such as the Saildrones and the wave gliders, do measure waves. Because the waves play the role of a liquid boundary between the ocean and the atmosphere, they strongly interact with the two systems. Therefore, in the context of measuring the sub-mesoscale currents and their associated air-sea fluxes and mixing in the upper ocean, measuring waves is mandatory.

For instance, currents can enhance the breaking probability of the waves and thus the associated air-sea fluxes. One can notice the effect of the current on waves at front locations captured from the Twin-Otter aircraft.

Waves across current front from Twin-Otter aircraft. One can see more whitecaps on the left side of the front. Credit: Nick Statom.

During the cruise we have experienced a large number of sea states, from calm ripples to almost 4 meter (13 feet) wave height during one night (October 23rd). The wave height is not actually a drawback for instruments deployments and the life onboard; indeed, waves can be high, yet very long, allowing the ship to travel on them like on smooth hills. On the other hand, the steep waves, those that are short and high, definitely cause a strong pitch and roll of the ship and therefore an uncomfortable sleep or the end of CTD casts. However, those waves were always welcomed with joy by the night watch (from 4 p.m. to 4 a.m.). Seeing the dry lab, the dining room, and the bridge tilting by more than 10 degrees has nothing to envy from a traditional roller coaster. Make sure that your belongings are firmly attached!

A collection of photos of the ocean and the sky, showing varying heights of the waves.
Caption: Daily pictures of the sea-state from October 9th to the 29th from the Bold Horizon Credit: Gwendal Marechal

I spent most of my free time observing waves from the deck or the bridge of the ship. Well, my free time during daylight was no longer than 2 hours daily, and this was my chance to discuss with the whole scientific team, because this was the only time when everyone was awake. I took the opportunity to be with expert in air-sea interactions to learn about the atmospheric boundary layer from simple cloud observations or radiosonde deployments. Certainly, I have learned a lot about cloud formation, cloud dynamics, and how the clouds are strongly linked to the sea surface temperature. On my side, I tried to share my “nerdy” wave-knowledge about wave breaking, sea-spray emissions, wave modulation, and what I understand in general about this moving superficial layer of the ocean.

Measuring waves or not, this cruise was definitely a new crazy adventure at sea with the night watch team (Mackenzie, Jessica, Igor, Ben, and Alex) and the crew in general. I’m looking forward to the next cruise for a new journey!

Wave steepness and Significant Wave Height from the Point Reyes buoy offshore San-Francisco. The steepness has been computed from the mean wave period (T) and the significant wave height

Where No Map Leads: Reflections from NASA’s S-MODE Mission

By Leo Middleton, Scientist at Woods Hole Oceanographic Institute // Aboard the Bold Horizon //

Image of gray waters on a calm, foggy. Dolphins surface in the center of the image, no more than gray blobs disturbing the otherwise calm water.
Dolphins surfacing at a submesoscale front on a calm, foggy day – photo taken off of the stern of the Bold Horizon. Credit: Gwen Marechal

It’s like stumbling through a thick forest and breaking out into a glade. A quiet has settled on this piece of sea as the waves calm. You can’t make a good map to get to this place. In the ocean, these glades are always moving, twisting, being born into life by the collision of great currents, then breaking apart, fracturing and sinking beneath the waves. The cold water brought from below by the coastal winds creates a fog that lies heavy on the sea surface, creating this small, calm spot.

Places like this can be found by things with nowhere else to go. Throw something off the side of a boat and it will likely end up somewhere like here. We’re at a convergence zone that attracts floating debris of all sizes. In particular, it attracts minuscule plankton, along with all the things that eat them and all the things that eat those things and so on and so on. All of it dragged hereby the undulating ocean.

Blue flashes of plankton can be seen leaning off the side of the boat. A pod of porpoise playing in the waves and feasting on the fish that came to feed. Slicks of water, even calmer than the rest, drift by the ship; signaling abrupt changes in temperature and saltiness where water rises up to the surface, bringing fish food from below.

This place was formed by great ocean currents passing by one other, mixing a little, trading parts of themselves. That’s how we found it: we followed the cold water that rises at the coast (just west of San Francisco) as it gets stirred out into the Californian Current. As the seasons change, these currents will move and alter, but for now they’re making this lush ocean glade, full of life and movement out in the open sea.

Soon this place will be gone again: nothing is static in the ocean. Then what happens to all this life? The millions of tiny creatures who thrive in this glade. They sink. Forced underneath the warmer water, the cold water subducts, bringing down with it all the drifting plankton and all those gases it stole from the air. That’s what we’re here to capture, the moment the water sinks. We’re trying to fill bottles full of the water that has sunk, to examine how the plankton respond to this sudden change in environment. Once the fog clears, we’ll see the planes flying overhead:they’re trying to capture this same process from the sky.

The ocean below will be thankful for this event, refreshed and renewed by new chemicals and nutrients that reach down beyond where light touches; continuing this cycle that’s been present for so much longer than we’ve known about it. The contact with the surface survives as a memory for this water, that will slowly degrade as it continues its meandering path across the oceans.

Finding Nature at Sea During NASA’s S-MODE Field Campaign

By Alex Kinsella, Postdoctoral Investigator at Woods Hole Oceanographic Institution // Aboard the Bold Horizon //

My favorite part of being at sea is the opportunity to see unique parts of the natural world that aren’t accessible from land. My colleagues have done a fantastic job in their blog posts explaining the science that we’ve been conducting during S-MODE, so I want to take this opportunity to describe some of the sights that those of us on the Bold Horizon have been able to enjoy during our field work: birds, mammals, weather, and stars.

A black-footed albatross shows off its sleek wings over the wake of our ship. Credit: Alex Kinsella.

The nature highlight of the cruise for me has been the opportunity to see pelagic birds, which are those that spend most of their lives at sea and are rarely, if ever, seen from land. The most majestic seabird in our region is undoubtably the albatross, which uses an elegant method called dynamic soaring to fly with almost no effort. Throughout the cruise, we have seen many black-footed albatrosses, with as many as six at one time flying back and forth over the wake of our ship. By soaring in loops between a low-altitude track sheltered behind the waves and a higher-altitude track in the open air, they are able to harvest energy from small-scale wind shear to fly for miles without flapping their wings. These birds have been our most constant companions during the day, but we have also been joined overhead at night by many flocks of Leach’s storm petrels, blackbird-sized seabirds which have been in the midst of their autumn migration. Shearwaters, jaegers, murrelets, and fulmars have rounded out the pelagic cast for a wonderful birdwatching experience.

A black-footed albatross soars through the sunset, overlooking our operations on deck. Credit: Alex Kinsella.

The other prominent animal life during the cruise has been the marine mammals, which have sometimes showed up in impressive numbers. The California coast is a region of plentiful food availability due to large-scale upwelling of nutrient-rich deep water driven by northwesterly winds. Pods of Pacific white-sided dolphins have been swimming up to our ship to play in the bow wake, breaching and diving from side to side. We have spotted several fin whales too, which amaze us all and beckon a rush of scientists with cameras in hand. Ocean fronts are often nutrient hotspots, so it’s possible that the whales are searching for the same features that we are. 

One of the many whales that have wowed us with their spouts and dives. Credit: Alex Kinsella.

We have also been enjoying (and enduring) the vagaries of the weather, one of the most ancient forms of entertainment. The cruise has featured two contrasting weather patterns: in the first half of the cruise, we had an endless gray stratus deck and occasional dense fog. We didn’t see the sun, moon, or stars for over a week! Around the halfway point of the cruise, a cold front passed through and cleared away the low clouds, replacing them with mostly clear skies that have featured interesting patches of mid- and high-level clouds, but also interminable wind and waves.

Dramatic altocumulus clouds served as our re-introduction to the sky after the stratus deck finally lifted. Credit: Alex Kinsella.

For our purposes, the most important part of weather at sea is the ocean surface waves, the characterization of which we call the “sea state”. A calm sea state is much better for our operations, but a lively sea state can make for great nature-watching. My colleague Gwen Marechal, a postdoc at Colorado School of Mines, is our resident wave expert, and the way he looks at waves reminds me of the way that most of us look at wild animals. We’ll be gazing out at the ocean and Gwen will point off to the distance. “Bird?” I ask. “No, a really good wave!” he says with reverence and a smile. One can think of there being at least two “species” of waves: wind waves and swell, but in a given sea state, each passing wave is unique, with its own height and character. Watching for good waves can be as satisfying as watching for good birds.

Sea spray from a breaking wave forms an ephemeral rainbow. Credit: Alex Kinsella.

When we’ve had clear skies at night, stargazing has been a favorite evening activity, as it always is at sea. Jupiter has been rising in the early evening, giving us a bright companion in the southeast sky as we transition from day watch to night watch on the ship. Around 8 p.m. each night, the sun is far enough below the horizon that the Milky Way becomes clearly visible, along with familiar constellations like Ursa Major, Cassiopeia, and Sagittarius. Finding those landmarks in the sky can be harder at sea than in a city, because there are almost too many stars, so the familiar ones are harder to find! We have continued the maritime tradition of philosophizing under the stars at night, wondering about the ocean below, the sky above, and much more.

Four of our autonomous saildrone vehicles shine at night like new planets on the horizon. In the sky are stars from the constellations Ophiuchus and Hercules, but the photo captures only a tiny fraction of the stars visible by eye. Credit: Alex Kinsella.

Being at sea truly feels like being in another world, but, at least by surface area, this is what most of the world looks like. It has been a gift to be on the ocean watching this part of our planet in its daily motions. The science we’ve conducted on this cruise will help us understand one more piece of nature’s workings, but no amount of knowledge can quite capture the experience of being in the midst of it all.


A First Cruise Experience with NASA’s S-MODE Field Campaign

By Mackenzie Blanusa, M.S. student at the University of Connecticut // Aboard the Bold Horizon //

I had been patiently waiting and dreaming about this research cruise for months. Yet a few days before traveling from Connecticut to Oregon for ship mobilization, I couldn’t shake a feeling of denial – like I couldn’t believe I was really going to be out in the Pacific Ocean on a research vessel for an entire month.

Mackenzie, a young white woman in a long red coat, poses on the R/V Bold Horizon. She is leaning on the railing, with blue ocean water and a sunset behind her.
A picture of Mackenzie on the R/V Bold Horizon with a sunset in the background. Credit: Jessica Kozik

I am participating in NASA’s Sub-Mesoscale Ocean Dynamics Experiment (S-MODE) as part of the science party aboard the research vessel Bold Horizon. The focus of this experiment is to sample ocean fronts that are a few miles in size to study their dynamics and effects on vertical transport. The ocean fronts are sampled using aircraft, ship surveying, and autonomous platforms with names such as wave gliders, sea gliders, Saildrones, floats, and drifters. So being aboard the ship is just one piece of this complex research experiment.

Ben Hodges from the Woods Hole Oceanographic Institution (WHOI) holding the EcoCTD. The electric winch is on the right. Credit: Mackenzie Blanusa


On the R/V Bold Horizon I have been working the night shift from 4 p.m. to 4a.m. My nights mostly consist of running an instrument called an EcoCTD, which measures temperature, salinity, pressure, chlorophyll, backscatter, and oxygen. The EcoCTD is casted off the back of the ship using an electric winch and travels vertically through the water column to a depth of about 390 feet (120 meters), and is then reeled back in. We usually do this all through the night while driving back and forth across a front. The vertical profiles then get plotted through time and we utilize this data in real time to decide where to deploy autonomous instruments, collect water samples, and keep track of how ocean fronts are evolving.

A depiction of the EcoCTD data. Temperature (in degrees Celsius) is plotted as a time series vs. depth. The white contours are lines of constant density. A front can be seen at the surface as the temperature goes from cool (green) to warm (yellow). The pattern repeats itself as we go back and forth across the front. Credit: Ben Hodges
A picture of a wave glider used in the S-MODE experiments. Credit: Mackenzie Blanusa

Additionally, I have been helping with the recovery and deployment of wave gliders and mixed layer floats. Wave gliders are an autonomous surface vehicle that look like a surfboard and are powered by waves and solar energy. They measure variables such as velocity, temperature, salinity, wind speed and direction, air pressure, and radiation. There are eight wave gliders in this experiment, and we had to recover one of them because it had a broken sensor. The mixed layer floats are recovered and deployed every few days and are tasked with floating in the mixed layer to measure vertical velocity.

Mackenzie (left) and Avery Snyder (right) getting ready to deploy a mixed layer float. Credit: Alex Kinsella

Aside from all the science, it’s also worth mentioning what life on a research vessel is like. It often feels simpler than the hustle and bustle of everyday life on land – I have a set 12-hour shift doing a very specific task, get meals provided for me, and have limited communication with the rest of the world. Everything feels more clear-cut, and I know what my purpose is. Of course, sea going is also mentally tolling due to the constant rocking back and forth. But we’ve been lucky with mostly good weather, and I haven’t gotten seasick yet.

While S-MODE is certainly a busy experiment with a lot of moving parts, there are moments where it feels like there is nothing to do. This often happens when the weather and sea state is too rough for sampling, so we are forced to find other ways to occupy our time…which can be challenging since you’re in the middle of the ocean with little entertainment. Times like these are met with playing silly games, watching a movie, and learning how to tie different types of knots.

S-MODE is wrapping up in a few days and I’ll be on my way back home. The sense of denial I once felt has been replaced with self-confidence and motivation to pursue a career as a seagoing oceanographer. I have learned so much from all the other scientists on board who are more than happy to share their knowledge with a curious graduate student. Although S-MODE is ending, I know this is just the beginning of my journeys at sea.

Life at Sea: A “First-Timer” Chronicles NASA’s S-MODE Field Campaign

By Sarah Lang, Ph.D. student at the Graduate School of Oceanography, University of Rhode Island. // Aboard the Bold Horizon //

Going to sea for the first time as part of NASA’s S-MODE mission has been an experience like no other. You establish a new normal on the boat and quickly fall into new routines. Perceptions of time even change! I joked with some people on the boat that time is but a label on our samples. Perhaps that’s a bit dramatic, but normal perceptions of time do not apply at sea –especially if you start your day at 2 pm and finish at 2 am.

For me, time flies the fastest when Pat Kelly and I are taking biological samples for long periods of time, looping through our collaborative Spotify playlist titled “boat songs. With Talking Heads, Madonna, Mötley Cru, and Fleetwood Mac, we have quite the mix. Pat rolls his eyes any time one of my disco songs comes on, but I know he secretly loves it.

Caption: First sunset off the Bold Horizon after many cloudy days!

For those on the night shift, their work day doesn’t begin until 4 pm in the afternoon and doesn’t end until 4 am. They have lunch in the middle of the night! And a cup of joe with breakfast at the same time those on land are getting home from work.

Most people have the day shift (0400 – 1600) or the night shift (1600 – 0400). A few of us on the biology team have schedules that change all the time, so I get to experience a bit of both.

The day shift is nice because that’s when most meals are served, and if you keep your eyes peeled you might see dolphins, sea lions, or whales. The night shift has its perks too. Typically, there is a movie playing in the lounge for those on break. It’s a bit quieter on the boat, except when we’re laughing at Flight of the Conchords or dancing on the back deck during EcoCTD shifts (an EcoCTD is a vertical profiler measuring physical and biological variables). We’ve only had one day of (semi) clear skies, so nights on the water have been especially dark. Beyond the light of the boat, it’s pure darkness. No light from land in sight.

Caption: (Left) Alex Kinsella, Leo Middletown, Igor Uchôa Farias, and Kelly Luis standing on the deck as we depart San Francisco harbor after a quick pit stop. (Middle) The Bold Horizon sailing on the blue sea, with a CTD-Rosette sitting on the deck. (Right) Audrey Delpech and Mackenzie Blanusa in immersion suits, AKA gumby suits. These are safety suits that protect against hypothermia in the case of an emergency.

Now onto the science!

We are here to study submesoscale (small! 1-10 km) dynamics in the ocean, which are associated with significant vertical velocities. We care about how climate-relevant parameters like heat and carbon are taken up by the ocean and what happens to them once they are in the ocean. Submesoscale features change really fast, which makes them very difficult to study. In this campaign, we are studying these features with autonomous vehicles (like Saildrones and Wave gliders), Lagrangian floats (which move with the water), airplanes, and of course, the ship. We’ll need all the data we can get to understand these complicated and quickly-changing processes!

Caption:(Left) Deploying the CTD-Rosette to collect seawater samples at depth, as well as vertical profiles of temperature, salinity, oxygen, backscatter, and chlorophyll-fluorescence. (Middle) Igor Uchôa Farias and Mackenzie Blanusa on Eco-CTD watch, listening to Megan Thee Stallion. (Left) Jessica Kozik and Mara Freilich working on computers in the “dry lab,” with the “wet lab” behind them.

Many of us on the biology team are interested in how these smallscale processes structure phytoplankton communities. Phytoplankton are microscopic organisms that undergo photosynthesis, taking up carbon from the ocean and producing much of the oxygen we breathe. They are the base of the marine food web, so if you like fish and dolphins and other sea creatures, you like phytoplankton! It’s important to know the controls on the distributions of phytoplankton species. Complex ecological interactions in the ocean are important to the ocean’s carbon cycle, and therefore, Earth’s climate system.

“Ocean color” is a key piece to this puzzle. We use light to study the biogeochemistry of the ocean. Light interacts with water and the “stuff” that’s in the water (like phytoplankton!). We can quantify these interactions with optical measurements to understand more about the biogeochemistry of the ocean. This is also how we can study the biology of the ocean from space.

In my next blog post, I’ll talk about how we use seawater samples to validate optical measurements, and how we use these optical measurements to understand measurements taken by hyperspectral sensors on airplanes (and eventually in space by NASA’s PACE mission!).