Skip to content
New issue

Have a question about this project? Sign up for a free GitHub account to open an issue and contact its maintainers and the community.

By clicking “Sign up for GitHub”, you agree to our terms of service and privacy statement. We’ll occasionally send you account related emails.

Already on GitHub? Sign in to your account

[Fleet]: event.datasets field is blank with logs under Logs tab. #27404

Closed
amolnater-qasource opened this issue Aug 12, 2021 · 23 comments · Fixed by #27433
Closed

[Fleet]: event.datasets field is blank with logs under Logs tab. #27404

amolnater-qasource opened this issue Aug 12, 2021 · 23 comments · Fixed by #27433
Assignees
Labels
bug Team:Elastic-Agent Label for the Agent team

Comments

@amolnater-qasource
Copy link

amolnater-qasource commented Aug 12, 2021

Kibana version: 7.15.0 Snapshot Kibana cloud environment

Host OS and Browser version: All, All

Build details:

Build: 43322
Commit: f448fcd00b319a3be0d1a1ae356956446e4d7ef8
Artifact Link: https://snapshots.elastic.co/7.15.0-af472020/downloads/beats/elastic-agent/elastic-agent-7.15.0-SNAPSHOT-linux-x86_64.tar.gz

Preconditions:

  1. 7.15.0 Snapshot Kibana cloud environment should be available.
  2. An agent must be installed with Default policy having System integration.

Steps to reproduce:

  1. Login to Kibana environment.
  2. Navigate to Agents>Logs tab.
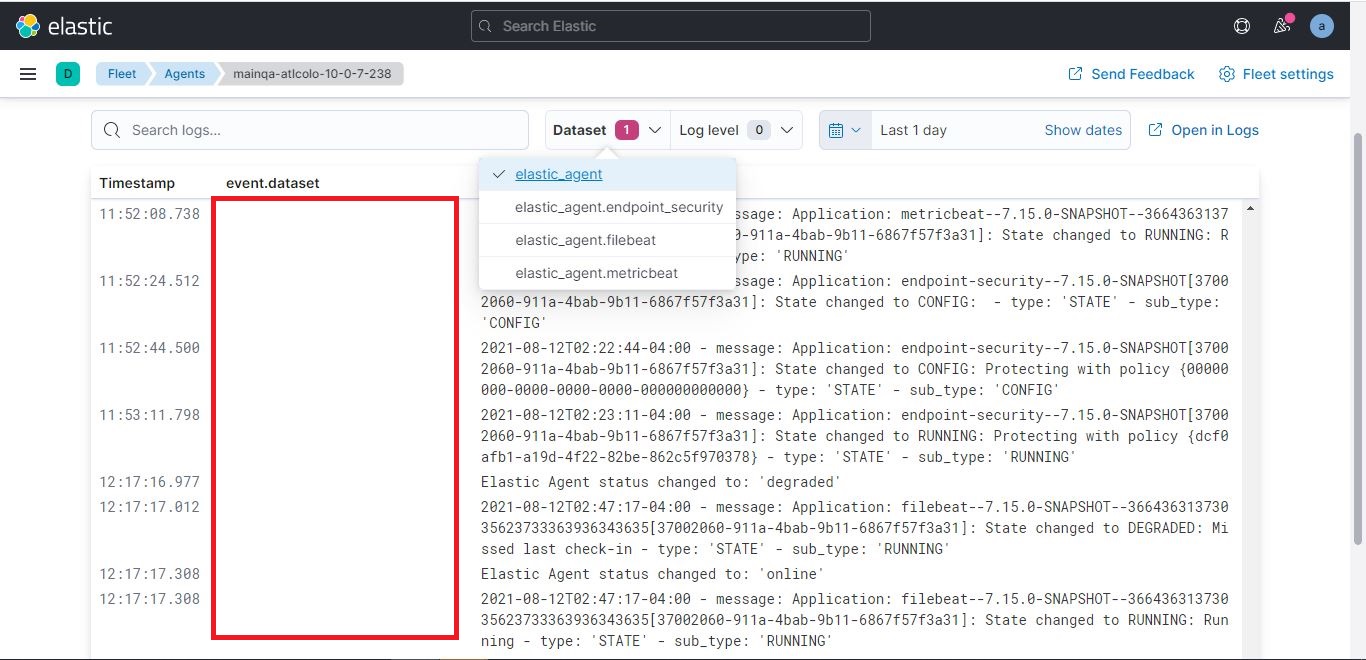
  3. Observe blank event.datasets with logs in the Logs field.

Expected Result:
event.datasets field should not be blank with logs under Logs tab. The dataset selected from Datasets dropdown should be visible under event.datasets field.

Note:

  • Datasets filter showing correct data as per selected filter under Logs tab, however just not event.datasets field is blank.

Screenshot:
4

@elasticmachine
Copy link
Collaborator

Pinging @elastic/fleet (Team:Fleet)

@amolnater-qasource
Copy link
Author

@manishgupta-qasource Please review.

@manishgupta-qasource
Copy link

Reviewed & Assigned to @jen-huang

CC: @EricDavisX

@jen-huang
Copy link

jen-huang commented Aug 16, 2021

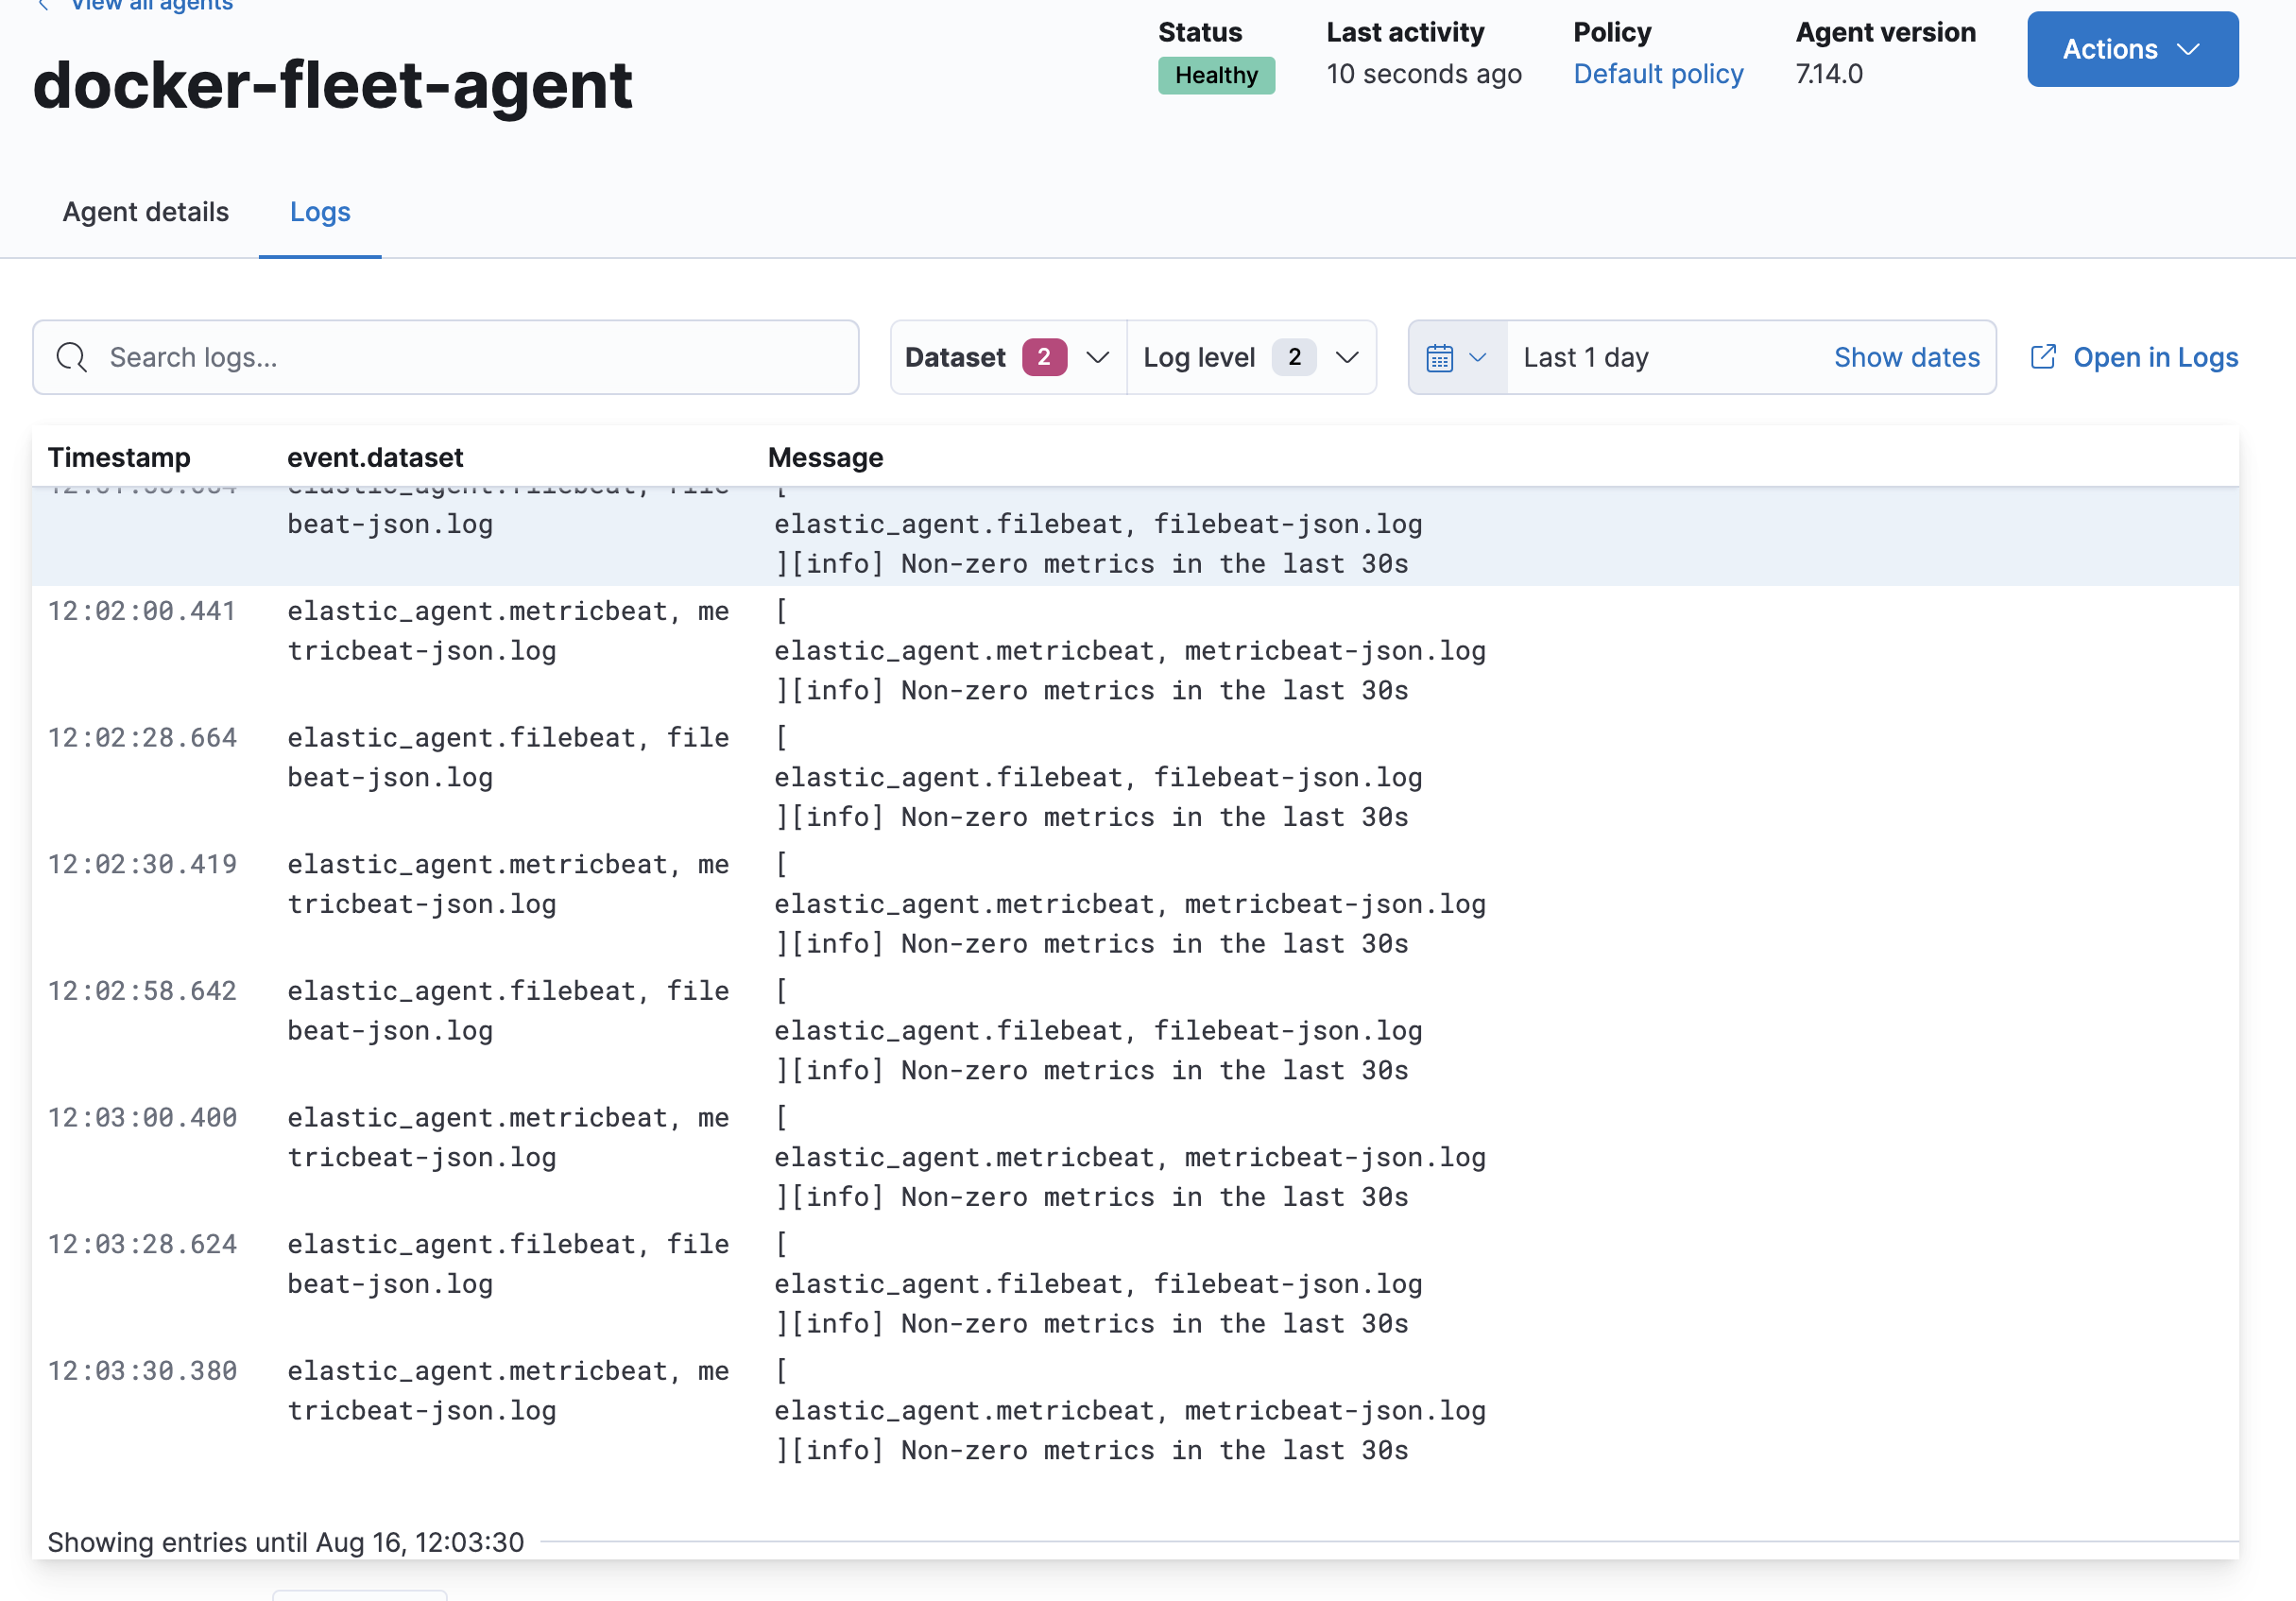
Looks like this is happening because multiple values are being written to event.dataset field and the UI handles strings only, not arrays of strings. As you can see in the screenshot this happened when I tested a 7.14 agent too:

image

This looks like something the agent team should look at and confirm if these kind of values are expected (metricbeat-json.log doesn't seem right for this field IMO).

@jen-huang jen-huang transferred this issue from elastic/kibana Aug 16, 2021
@jen-huang jen-huang added bug Team:Elastic-Agent Label for the Agent team labels Aug 16, 2021
@elasticmachine
Copy link
Collaborator

Pinging @elastic/agent (Team:Agent)

@EricDavisX
Copy link
Contributor

if this is coming from a 7.14 Agent, I'd ask for further review to see how impactful this may be. we might fix it more urgently if it is impactful.

@michel-laterman
Copy link
Contributor

I'll take a look, the issue is present on 7.14.0
Screen Shot 2021-08-16 at 12 09 05 PM

looking into the actual log entries, event.dataset appears as two keys in the document.

    "event": {
      "dataset": "elastic_agent.metricbeat"
    },

Once with the expected value

    "event.dataset": [
      "elastic_agent.metricbeat",
      "metricbeat-json.log"
    ]

and at the end with an array

@andrewkroh
Copy link
Member

andrewkroh commented Aug 16, 2021

Does anyone know where the event.dataset value of {beatname}-json.log originates? The _source looks like this

"_source": {
    ...
    "event": {
      "agent_id_status": "verified",
      "ingested": "2021-08-16T19:19:01Z",
      "dataset": "elastic_agent.filebeat"
    },
    "event.dataset": "filebeat-json.log"
}

Agent adds [event][dataset] in the Filebeat config that's generated to collect logs. Those logs are parsed as JSON, so I wonder if the original log contained event.dataset: {beatname}-json.log (I don't know why the logs would.)?

{
"add_fields": map[string]interface{}{
"target": "event",
"fields": map[string]interface{}{
"dataset": fmt.Sprintf("elastic_agent.%s", name),
},
},
},

@jen-huang
Copy link

@michel-laterman Interesting that your UI screenshot actually displays values in the event.dataset column when it is an array (mine off of master shows blank). What version of Kibana are you running?

@michel-laterman
Copy link
Contributor

7.14.0 using elastic-package

@michel-laterman
Copy link
Contributor

@andrewkroh, It looks like the filename event.dataset entries are being written directly into the logs. For example filebeat-json.log contains:

{
  "log.level":"info",
  "@timestamp":"2021-08-16T20:02:19.901Z",
  "log.logger":"api",
  "log.origin": {
    "file.name":"api/server.go",
    "file.line":62
  },
  "message":"Starting stats endpoint",
  "service.name":"filebeat",
  "event.dataset":"filebeat-json.log",
  "ecs.version":"1.6.0"
}

this only occurs with the log entries (no dataset arrays for metrics)

@michel-laterman
Copy link
Contributor

the filename dataset entries are added as part of the ECS annotations:

beats/libbeat/logp/core.go

Lines 199 to 205 in afde058

if cfg.ECSEnabled {
fields := []zap.Field{
zap.String("service.name", cfg.Beat),
zap.String("event.dataset", cfg.LogFilename()),
}
options = append(options, zap.Fields(fields...))
}

@jen-huang
Copy link

@hop-dev Can you take a look on the Fleet side to see why the LogStream UI component might be showing different behavior on 7.15/master (empty column) vs 7.14 (column correctly shows array values)?

@ruflin
Copy link
Member

ruflin commented Aug 17, 2021

Adding the LogFileName as event.dataset sounds like a bug and is not ECS conform. It was added here: #25998 @axw Do you remember by chance what it was added to event.dataset? @michel-laterman We should remove this I think.

@ruflin
Copy link
Member

ruflin commented Aug 17, 2021

@felixbarny I see you suggested apm-server.log as event.dataset in #25997? This sounds off.

@felixbarny
Copy link
Member

@ruflin is that because the data_stream.dataset and event.dataset fields are already set by Elastic agent's Filebeat config? Or is there a more fundamental reason why event.dataset="${service.name}.log" is not a good idea?

The idea was that each Beat/shipper defines its dataset and that the Filebeat config to ship the log files looks the same for every shipper, without needing to define the dataset. However, that requires event routing so that all logs can be sent to the same routing pipeline that routes the events based on the data_stream.dataset that's set in the logs.
Right now, it's probably premature to populate the dataset in the ECS logger config as it conflicts with the one set in the Filebeat config.

@ruflin
Copy link
Member

ruflin commented Aug 17, 2021

In general I like the idea that the dataset is already set in the log file. I think we have 2 problems here:

  • Having .log in the dataset name is a bit unfortunate. That it is a log should be defined by the type already. Lets remove it.
  • Filebeat can be run in standalone and with Elastic Agent. Depending on how it is run, logs should be shipped to a different place. When run by Elastic Agent the dataset value is elastic_agent.filebeat. For APM it is elastic_agent.apm_server. Where should these logs go in standalone? logs-apm_server-*?

Most important, there can only be a single dataset value in the logs or in the end event. I think the short term fix is that we get rid of the .log in the code and make sure elastic agent overwrites and not appends the dataset.

@felixbarny
Copy link
Member

felixbarny commented Aug 17, 2021

Having .log in the dataset name is a bit unfortunate. That it is a log should be defined by the type already. Lets remove it.

This seemed to be a best practice looking at datasets like haproxy.log, kibana.log, etc. Is that a practice you are moving away from? If so, we should also update the ECS logging spec.

Depending on how it is run, logs should be shipped to a different place.

Why not have the same datastream regardless of how it's run?

Most important, there can only be a single dataset value in the logs or in the end event.

++

@ruflin
Copy link
Member

ruflin commented Aug 17, 2021

I must confess I'm a but surprised by the "best practice" in ECS Logging. Why would we include .log if it is already defined by the type?

Why not have the same datastream regardless of how it's run?

I don't think I have good pure technical argument on this one. The way I think of it is: If you run just filebeat, this is the service you run and is monitored. As soon as you run Elastic Agent, it will run some processes which is an implementation detail for the user. How it writes logs is also an implementation detail. All the logs can be consumed under elastic_agent.*. If tomorrow filebeat becomes foobeat it should not change the basics around logging. I would go so far to say it is not ideal that each process has its own log file. That is why I should ship it to two different dataset.

@felixbarny
Copy link
Member

I must confess I'm a but surprised by the "best practice" in ECS Logging. Why would we include .log if it is already defined by the type?

Looking at examples (maybe from Beats modules, not sure), I thought that this was an established best practice, so I added it to the ECS logging spec as a default value. I don't feel strongly about the .log suffix at all and am happy to revise the spec. What would a better default be? Just the service name?

@hop-dev
Copy link

hop-dev commented Aug 17, 2021

I believe the root cause of the field not being shown in the table is that event.dataset is missing from the mapping, a similar issue has been discussed in #27405

@felixbarny
Copy link
Member

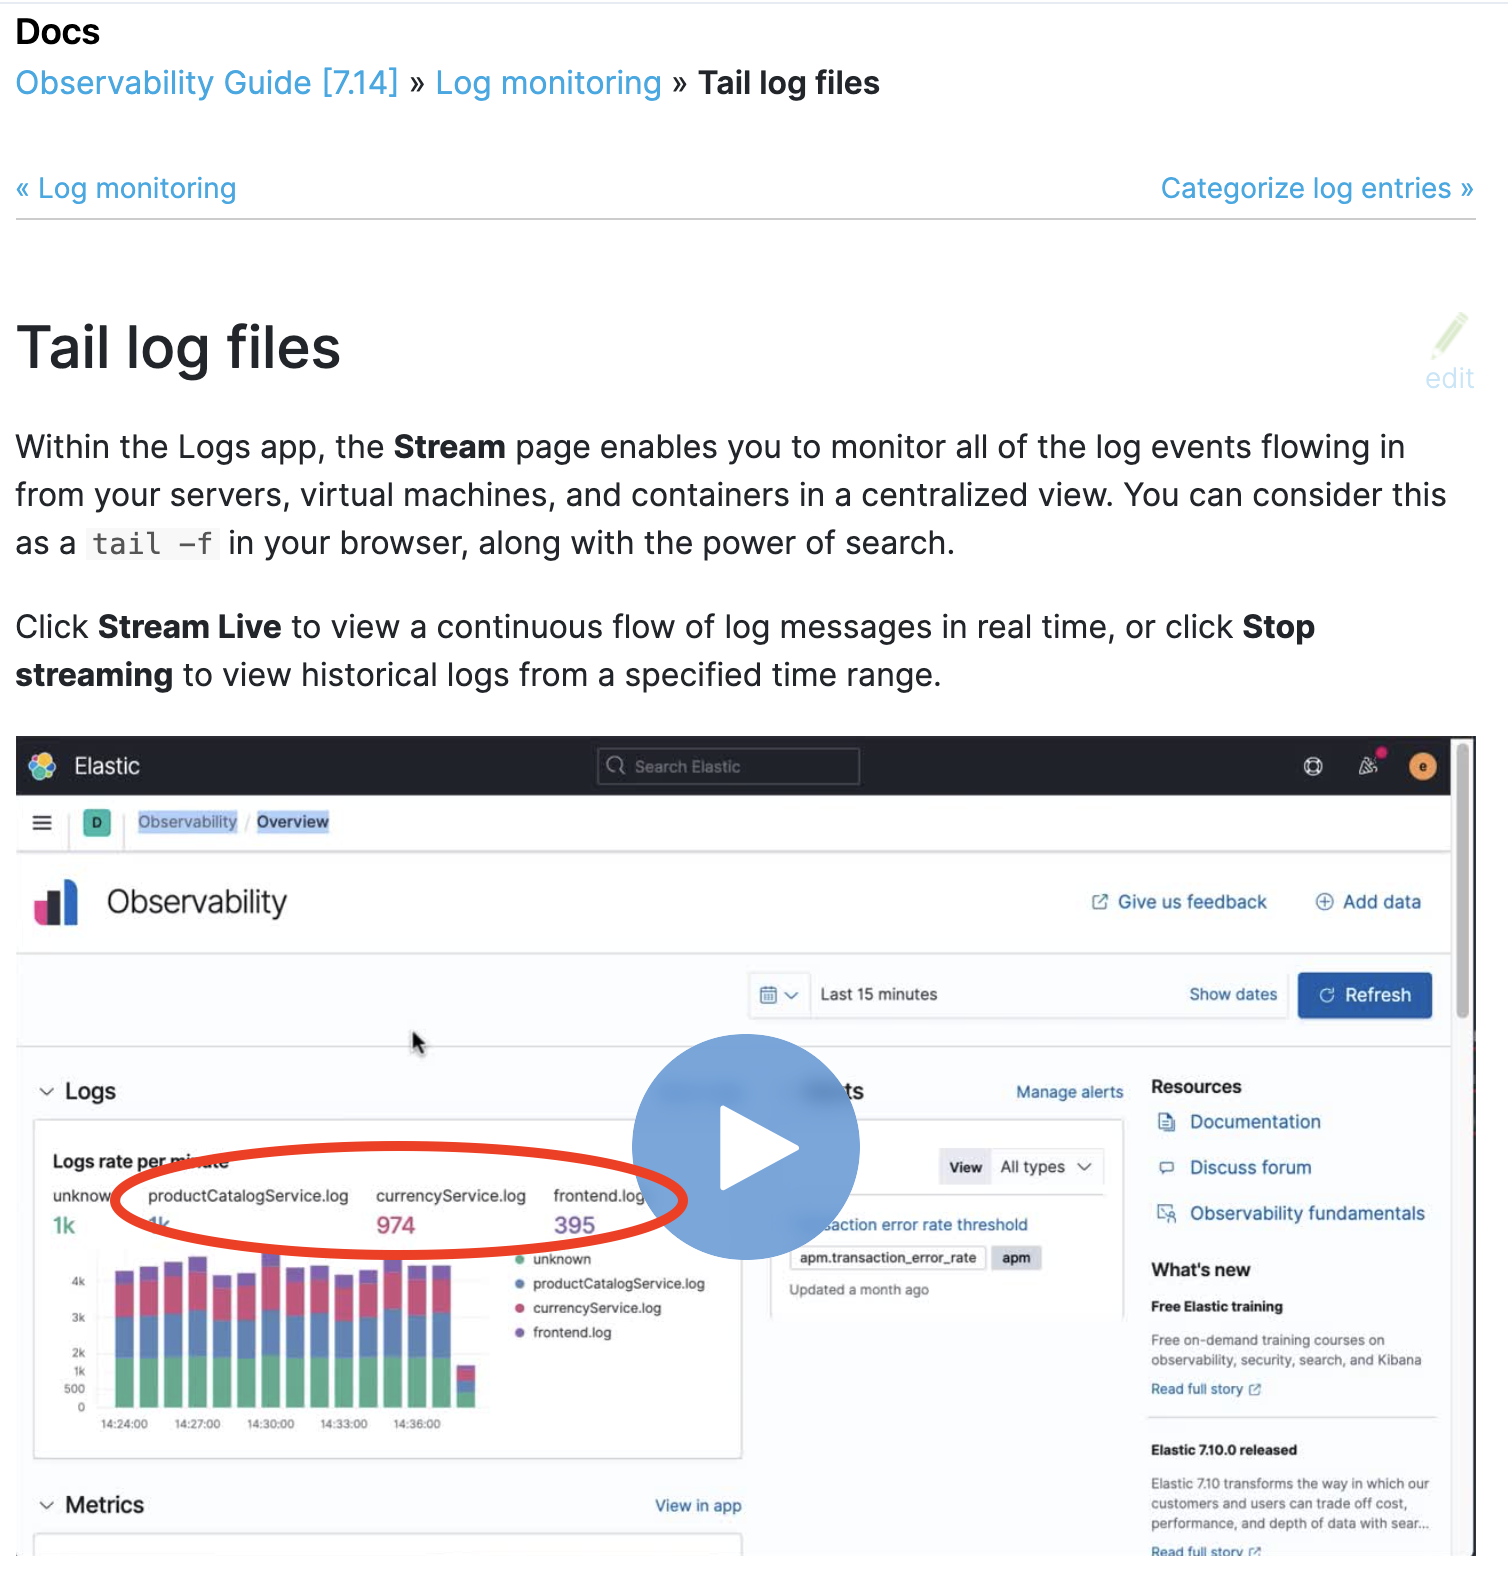
Looking at examples (maybe from Beats modules, not sure), I thought that this was an established best practice

@ruflin See also the example in the logs app docs

Screen Shot 2021-08-19 at 08 07 11

Do you have a suggestion for a better default?

@ruflin
Copy link
Member

ruflin commented Aug 19, 2021

I wonder where these values come from. In modules / packages we don't use .log and also don't use camelCase. The value of event.dataset consists normally of {service}.{more-details} so in the case of nginx it is nginx.access, nginx.error. If there is only a single log file for a service I would go just for {service}. We should also expand a bit on the dataset description of ECS: https://www.elastic.co/guide/en/ecs/current/ecs-event.html#field-event-dataset

In case of filebeat I assume the json logs and non json logs contain exactly the same content. So in the ideal scenario there is an ingest pipeline that converts both into the same format so we could just use filebeat as the dataset.

Sign up for free to join this conversation on GitHub. Already have an account? Sign in to comment
Labels
bug Team:Elastic-Agent Label for the Agent team
Projects
None yet
Development

Successfully merging a pull request may close this issue.

10 participants