


Abstract
The Kieffer model is a widely accepted explanation for seasonal modification of the Martian surface by CO2 ice sublimation and the formation of a "zoo" of intriguing surface features. However, the lack of in situ observations and empirical laboratory measurements of Martian winter conditions hampers model validation and refinement. We present the first experiments to investigate all three main stages of the Kieffer model within a single experiment: (i) CO2 condensation on a thick layer of Mars regolith simulant; (ii) sublimation of CO2 ice and plume, spot, and halo formation; and (iii) the resultant formation of surface features. We find that the full Kieffer model is supported on the laboratory scale as (i) CO2 diffuses into the regolith pore spaces and forms a thin overlying conformal layer of translucent ice. When a buried heater is activated, (ii) a plume and dark spot develop as dust is ejected with pressurized gas, and the falling dust creates a bright halo. During plume activity, (iii) thermal stress cracks form in a network similar in morphology to certain types of spiders, dendritic troughs, furrows, and patterned ground in the Martian high south polar latitudes. These cracks appear to form owing to sublimation of CO2within the substrate, instead of surface scouring. We discuss the potential for this process to be an alternative formation mechanism for "cracked" spider-like morphologies on Mars. Leveraging our laboratory observations, we also provide guidance for future laboratory or in situ investigations of the three stages of the Kieffer model.
Export citation and abstract BibTeX RIS

Original content from this work may be used under the terms of the Creative Commons Attribution 4.0 licence. Any further distribution of this work must maintain attribution to the author(s) and the title of the work, journal citation and DOI.
1. Introduction
Present-day Mars is a dynamic planet, rich with surface change despite its tenuous atmosphere and cold climate. In winter, a significant portion of Mars's primarily CO2 atmosphere accumulates onto the surface as frost (which we define in this paper as an umbrella term for all types of ice condensates); in the spring, it sublimes, revealing some morphologies that are unlike anything seen on Earth. These include dark dalmatian spots and oriented fans (Malin & Edgett 2001; Cantor et al. 2002; Kieffer et al. 2006), "fried eggs" (Kieffer et al. 2000), gullies (Diniega et al. 2013; Dundas et al. 2022) sometimes accompanied by dark digitate flows and bright "halos" in spring (Gardin et al. 2010; Pasquon et al. 2016), dendritic "spiders" (Piqueux et al. 2003; Hansen et al. 2010; Mc Keown et al. 2023), sand furrows on active dunes (Bourke & Cranford 2011), and growing dendritic troughs on interdune material (Portyankina et al. 2017b). Many of these features have been detected on loose material around the south pole (Piqueux et al. 2003; Hansen et al. 2010; Mc Keown et al. 2023) and on interdune material toward the south polar midlatitudes (Diniega et al. 2013; Portyankina et al. 2017b). However, some minor phenomena have been detected in the north (Hansen et al. 2023). Many of these features compose the "Kieffer zoo" first described in Kieffer (2003) (Figure 1)—a collection of surface expressions proposed to be engendered by the solid-state greenhouse effect−motivated "Kieffer model" (Kieffer et al. 2006). In this model, sunlight penetrates translucent slab ice in spring and thermal-wavelength radiation gets trapped, heating the regolith beneath the ice and causing the impermeable ice slab to sublimate from its base. Through this process, spiders are proposed to be eroded via high-velocity gas scouring the sub-slab regolith (Piqueux et al. 2003), while fans and variations of spots are strewn on the ice surface, deposited by a plume of dust and gas (Kieffer et al. 2006).

Figure 1. Some examples of the "zoo" of features proposed to be formed by seasonal CO2 sublimation dynamics on Mars. (a) "Thin" spiders within the south polar layered deposits, based on HiRISE image ESP_055283_0985, lat = −81 454, lon = 296269, Ls
= 89°. (b) Dark spots on top of a layer of translucent CO2 slab ice covering a cluster of "fat" spiders at Inca City. HiRISE image ESP_037877_0985, lat = −81378, lon = 295743, Ls
= 1847. (c) "Fried eggs" showing rings of dark dust surrounded by bright halos. (d) Patterned ground within the high south polar latitudes with dark oriented fans indicative of wind direction and some bright, white fans. HiRISE image ESP_073472_0950, lat = −85035, lon = 259029, Ls
= 1995. (e) Bright halos surrounding SPRC Swiss cheese depressions (Becerra et al. 2016). HiRISE image PSP_004989_0945, lat = −85654, lon = 6338, Ls
= 67°. (f) "Lace terrain," a type of patterned ground suggested to be polygonally patterned ground later scoured and eroded by surface-flowing CO2 gas from the Kieffer model (Hansen et al. 2011). PSP_002532_0935 at lat = −864 and lon = 99016, Ls
= 1811. (HiRISE/Jet Propulsion Laboratory/University of Arizona.)
454, lon = 296269, Ls
= 89°. (b) Dark spots on top of a layer of translucent CO2 slab ice covering a cluster of "fat" spiders at Inca City. HiRISE image ESP_037877_0985, lat = −81378, lon = 295743, Ls
= 1847. (c) "Fried eggs" showing rings of dark dust surrounded by bright halos. (d) Patterned ground within the high south polar latitudes with dark oriented fans indicative of wind direction and some bright, white fans. HiRISE image ESP_073472_0950, lat = −85035, lon = 259029, Ls
= 1995. (e) Bright halos surrounding SPRC Swiss cheese depressions (Becerra et al. 2016). HiRISE image PSP_004989_0945, lat = −85654, lon = 6338, Ls
= 67°. (f) "Lace terrain," a type of patterned ground suggested to be polygonally patterned ground later scoured and eroded by surface-flowing CO2 gas from the Kieffer model (Hansen et al. 2011). PSP_002532_0935 at lat = −864 and lon = 99016, Ls
= 1811. (HiRISE/Jet Propulsion Laboratory/University of Arizona.)
Download figure:
Standard image High-resolution imageThe Kieffer model has been widely accepted for the two decades following the Mars Global Surveyor (MGS) Mars Orbiter Camera's (MOC) first observation of spiders (Piqueux et al. 2003) and thermal measurements from the Thermal Emission Spectrometer (TES), which indicated that fans and spots overlay translucent slab ice (Kieffer et al. 2006). However, many open questions remain surrounding the formation of these enigmatic landforms, which are intricately linked in morphology to their local formation conditions (Mc Keown et al. 2023). Mainly, it is as yet not clear whether spiders continue to grow today (and grow to an extent not yet visible by high-resolution imagery) or are relict features, providing a record of short-timescale seasonal dynamics during past climate regimes on Mars.
Understanding empirically the link between morphology, activity, and environmental parameters is critical to addressing this important question. As certain spider morphologies and activity levels may be closely tied to seasonal conditions specific to governing climate regimes, understanding this link is important for larger, even global questions regarding Mars's history, such as unraveling details about seasonal behavior within the climate record. However, the driving formation mechanism responsible for all of these processes does not occur naturally on Earth. In addition, there is as yet no spacecraft on Mars able to gather in situ empirical measurements of spider and plume formation. Therefore, analog experiments are imperative to understanding in detail this seasonal process modifying the Martian surface today, which may also have modified it in the planet's dynamic past.
In this paper, we present laboratory experiments where we condensed CO2 on Mojave Mars Simulant (MMS) <150 μm (Peters et al. 2008), for simulated Mars winter temperature and pressure regimes. We have, for the first time, created the full cycle of the Kieffer model in the laboratory. Our work simulates CO2 frost condensing onto the surface, preferential warming within an area, and subsequent formation of a plume. However, unlike the Mars Kieffer model, our heat input was derived from a local strip heater placed beneath the regolith simulant surface and did not replicate the gradual basal heating expected from insolation receipt. Despite a large difference in spatial scale, we confirm the formation of several types of Kieffer zoo features within this system. Based on our known conditions of our laboratory environment and observations of those active changes, we comment on the analogous processes active on Mars.
1.1. The Kieffer Model
The Kieffer model has been well accepted for the formation of a "zoo" of seasonal features on Mars for over two decades (Kieffer et al. 2006) and is briefly outlined here. For a more detailed overview of the Kieffer model in relation to these features, we refer the reader to Kieffer (2003) and Mc Keown et al. (2023). The Kieffer model is a hypothesized conceptual model based on visible and thermal infrared observations (Piqueux et al. 2003; Kieffer et al. 2006) that suggest that, in spring, sunlight penetrates seasonally condensed translucent impermeable CO2 slab ice and is absorbed by the uncohesive regolith beneath the ice. In this study, we consider the model broken into three main stages:
- 1.Stage 1/CO2 frost deposition. CO2 condenses out of the Martian atmosphere in winter and forms a translucent slab ice layer through which solar radiation can penetrate, but thermal emission from the warmed ground is trapped.
- 2.Stage 2/Sublimation dynamics. Solar radiation penetrates though the ice to warm the underlying regolith, while being opaque to the infrared. Infrared wavelength radiation then gets trapped beneath the ice, in a process known as the solid-state greenhouse effect (Matson & Brown 1989). This trapped energy causes sublimation at the base of the CO2 ice overburden. This generates a gas pressure buildup, eventually levitating the ice layer and causing it to crack at weak spots, allowing high-velocity gas to rush in conduits toward the "vent." The eroded material is deposited on top of the ice via a plume, in the form of dark spots. Some of these spots develop into fans, oriented with the direction of local wind. Some spots have halos of bright material around them and are known as "fried eggs."
- 3.Stage 3/Resultant morphology. In conjunction with the deposition of fans and spots via plume activity, networks of dendritic troughs are eroded in the substrate via the high-velocity escaping CO2 gas. When the seasonal ice eventually sublimates diffusely in late spring/early summer, these are identified as spiders, sand furrows, and dendritic troughs.
While the broad outline of the Kieffer model appears well accepted, different models of the detailed processes involved have been proposed since its inception and tested against available observations. For example, some models have suggested that spacing of spiders is linked to porosity and permeability of the ice layer (Hao et al. 2020) or of the ice thickness (Mc Keown et al. 2022), as that controls the velocity of escaping gas beneath the ice layer. Some models proposed that CO2 diffuses into the regolith pore spaces sublimating from within (Pilorget & Forget 2016), while others have argued that the overlying slab is flexed and lifted (Portyankina et al. 2012; Attree et al. 2021). In noting that some fans and spots appeared earlier during polar twilight, another "conduction" variant of the Kieffer model offered an alternative to the cyclic buildup and exhaustion of an insolation-induced pressurized gas layer trapped between the regolith and overlying ice (Aharonson et al. 2004). Aharonson et al. (2004) proposed that the heat deposited in Sun-exposed (non-ice-covered) ground during the summer season is delivered up to the ice slab during the winter months and can result in a basal sublimation mass flux sufficient to account for 100% of the sublimation budget in winter and an appreciable component of the basal gas sublimated in spring.
In all cases, CO2 deposition and sublimation modes will have a feedback with environmental properties such as substrate consolidation, thermal inertia, regolith grain size distribution, and whether there is permafrost within the top layer. Understanding the relationship between activity, morphology, and these environmental conditions better may help us to distinguish between these model variations. We may then use remote-sensing measurements of surface activity or morphologies as a window into past and present formation environments. Empirical observations of the processes involved in the Kieffer model, even on a small scale, are key to validating models applied toward Mars and ultimately understanding the surface conditions under which the Kieffer model operates and seasonally modifies the Martian surface.
1.2. Features Proposed to Form via the Kieffer Model
Described here are the observable features that have been used to test and quantify the processes invoked within the Kieffer model, due to the basal sublimation of the CO2 ice layer and subsequent dynamics involved in volatile release. We first describe the features that are observable during the period of sublimation (i.e., during Stage 2) and then the morphology that may remain after defrosting has concluded (Stage 3).
1.2.1. Stage 2: Spots, Fans, and Halos
Observations with the MGS's MOC and TES revealed a host of relatively dark features that appear on top of the seasonal CO2 ice layer in spring (Kieffer et al. 2006; Kieffer 2007). "Spots" or "blotches" are radially symmetric round or oblate dark patches that often appear in spider locations in spring (Kieffer 2007; Portyankina et al. 2010; Thomas et al. 2011), while fans are stretched and oriented in the direction of local winds (Kieffer 2007; Aye et al. 2019).
"Halos" were identified as belted regions of uniform brightness surrounding dark spots. Other bright features have been identified related to dust deposition, such as halos surrounding Swiss cheese terrain pits and scarps on the South Polar Residual Cap (SPRC; Becerra et al. 2016) and bright edges surrounding linear dune gully recurring diffusive flows (Pasquon et al. 2016; Mc Keown et al. 2021). Halos, in the context of spots, were originally suggested to be due to metamorphism of the CO2 slab material because of strain from diurnal flexure caused by basal sublimation (Kieffer 2007). An alternative formation mechanism was proposed by Titus et al. (2007), albeit for bright fans, which used near-infrared observations to show that their material consisted of CO2 frost. This work suggested that the bright material forms owing to adiabatic cooling of gas spewing downwind from the jets producing CO2 frost, which settles on the surface of the ice downwind. Pommerol et al. (2011) suggested that they are due to sinking of dust grains into the ice because many halos tended to appear after the original spot deposition. Thomas et al. (2010) proposed that when the pressure is locally raised by CO2 plume activity, the equilibrium vapor pressure is exceeded for the ambient temperature. Therefore, condensation occurs, and dust drag on the gas is required to reach supersaturation and condensation. Thomas et al. (2010) had not seen supersaturation in their simulation runs, but they had only conducted simulations in the frame of a steady-state solution; it is possible that a transient model is required to allow for supersaturation and subsequent condensation to occur during a jet eruption. Several studies have been carried out with the aim of elucidating the origin and progression of these ringed features (Martinez et al. 2012; Cesar et al. 2022), showing various classifications based on change detection observed in images showing temporal evolution of spots. However, empirical studies of halo formation have not been conducted. Additionally, there has been no definitive evidence of active plumes despite extensive monitoring with the High Resolution Imaging Science Experiment (HiRISE) camera and Color and Stereo Surface Imaging System (Hansen et al. 2019).
1.2.2. Stage 3: Araneiforms
Araneiforms compose a family of dendritic features on Mars, classified according to their scale and apparent activity level: spiders (Piqueux et al. 2003), dendritic troughs (Portyankina et al. 2017b), and sand furrows (Bourke & Cranford 2011). All araneiform types are posited to be formed as a result of escaping pressurized CO2 gas beneath the seasonal ice slab and its interaction with the Martian surface, as outlined in the above description of the Kieffer model. Spiders are striking dendritic, tortuous, often radial networks of negative topography troughs that are native to the "cryptic region" (Kieffer et al. 2006) among the Martian south polar layered deposits and surrounds (Piqueux et al. 2003; Schwamb et al. 2018). Many of their morphologies comprise a central pit and radial "legs" (Hansen et al. 2010), and they range in scale from <50 m to >1 km. Their morphologies range from "thin" to "starburst" to "fat" and may be governed by slope and substrate properties, with many of them appearing in clusters with distinct distances between them (Hansen et al. 2010; Hao et al. 2019; Mc Keown et al. 2022). During southern spring, relatively dark albedo fans and spots (Hansen et al. 2010; Portyankina et al. 2010; Thomas et al. 2011), as well as bright halos (Kieffer 2007; Titus et al. 2007), are observed within their locales. Spiders can often be found within the locales of high-latitude patterned ground. Some of these terrains are suggested to form as a result of thermal contraction, possibly driven by sublimation dynamics in the current climate (Mangold 2005; Levy et al. 2009). Some high south polar araneiforms appear densely organized, overlapping with no distinct central region among interwoven troughs, and have thus been named "lace terrain." It has been suggested that some instances of this terrain may be patterned ground with polygon edges eroded by overlying escaping gas conduits, creating an anastomosing pattern (Hansen et al. 2011).
Sand furrows and dendritic troughs are smaller, less well-developed features that were recently detected on dune lee slopes (Bourke & Cranford 2011; Bourke 2013) and within interdune regions (Portyankina et al. 2017b), respectively, and are also attributed to the Kieffer model in a similar way to spiders. The main difference between spiders, furrows, and dendritic troughs is that the last two have been observed to form and be erased or extended in the present day, whereas spiders have not been observed to grow or newly form over the past two decades of high-resolution change detection imagery with HiRISE (McEwen et al. 2007). The reasons for the differing morphologies and apparent activity levels/lack thereof for all of these features have been largely unconstrained, mainly due to a paucity of Earth analogs or ground-truth data.
1.3. Analog Experimental Work to Test the Kieffer Model
While the Kieffer model is generally accepted as the starting description of Martian seasonal frost evolution and related surface-altering processes and has been shown to be consistent with many observations of Mars, the full cycle has never been replicated in the lab. In prior work, parts of the cycle have been empirically investigated or modeled:
- 1.Stage 1/CO2 frost deposition. Sylvest et al. (2016, 2018) condensed CO2 on a slope of Mars regolith simulant under Mars conditions for the first time, but this work focused on mass wasting processes relevant for sand dune gullies and did not replicate plumes or spider morphologies. Portyankina et al. (2017b) condensed a thin layer of CO2 ice on a cold plate and on a two-particle-thick layer of regolith and showed that the temperature and pressure ranges under which a thin layer of translucent CO2 slab ice condenses were those expected for Mars polar winter atmospheric conditions. However, this work focused on the ice types that formed and, because the substrate layer was so thin, did not explore the effects of sublimation, such as the production of plumes or spider-like features.
- 2.Stage 2/Sublimation dynamics. Cesar et al. (2020) investigated empirically the self-cleaning component of the Kieffer model by illuminating samples of dust emplaced on CO2 ice blocks and showing that they migrated down through the ice, forming sublimation vapor prisons as suggested by Kieffer (2007). Kaufmann et al. (2006) showed that embedded dust within a cavity between two blocks of CO2 ice will be mobilized via sublimation activity when a solar simulator is directed on it, but mobilization was lateral at the interface and neither plumes nor spider patterns were generated.
- 3.Stage 3/Resultant morphology. de Villiers et al. (2012) used a Hele–Shaw cell to demonstrate that dendritic patterns form when gas flows through a porous material, as such patterns are favorable for many examples of energy dissipation in nature (Portyankina et al. 2017a). Diniega et al. (2013) and Mc Keown et al. (2017, 2021) demonstrated that dendritic spider-like patterns form when pressurized CO2 gas flows at the interface between a sublimating CO2 ice block and porous substrate. However, in these Mars-focused studies, premade CO2 ice blocks were placed on top of the substrate, and some experiments were performed under ambient Earth conditions. Furthermore, edge effects from the small (20 cm × 10 cm × 2 cm) blocks hampered morphological simulation.
2. Methods
We designed and performed a suite of analog experiments in the Jet Propulsion Laboratory's Dirty Under-vacuum Simulation Testbed for Icy Environments (DUSTIE) thermal vacuum chamber. We aimed to simulate the Kieffer model on the laboratory scale and to investigate the dynamics and morphologies that result when CO2 ice is condensed on MMS < 150 μm (Peters et al. 2008) and then the interface between that ice and the simulant is heated. We chose a grain size of <150 μm, as thermal inertia observations have indicated dustlike, loose material in the south polar regions where spiders are located (Putzig et al. 2005; Mc Keown et al. 2023).
2.1. The Jet Propulsion Laboratory DUSTIE Thermal Vacuum Chamber
NASA JPL's DUSTIE chamber (Figure 2) is a 60 cm long, 45 cm in diameter thermal vacuum chamber capable of simulating temperature and pressure regimes typical of Mars winter and springtime polar temperature and pressure conditions. This "dirty testbed" is optimized for test procedures involving planetary simulants and can be pulled to near-vacuum (typical Mars pressure regimes) with a roughing pump. The chamber is cooled with a liquid nitrogen (LN2) plate and cylindrical and back shroud, which can be thermally regulated and kept at target temperature with proportional integral derivative (PID) controllers. The chamber is equipped with viewing ports for mounting cameras and can be purged with nitrogen gas (GN2) to reduce water vapor concentration. CO2 can be flowed into the chamber through a hose connected to a feedthrough, once desired planetary conditions are reached and its flow is regulated with a regulator and flow meter. The chamber is monitored for pressure and temperature using LabView, which measures signal from pressure sensors and thermocouples connected to a data acquisition device.
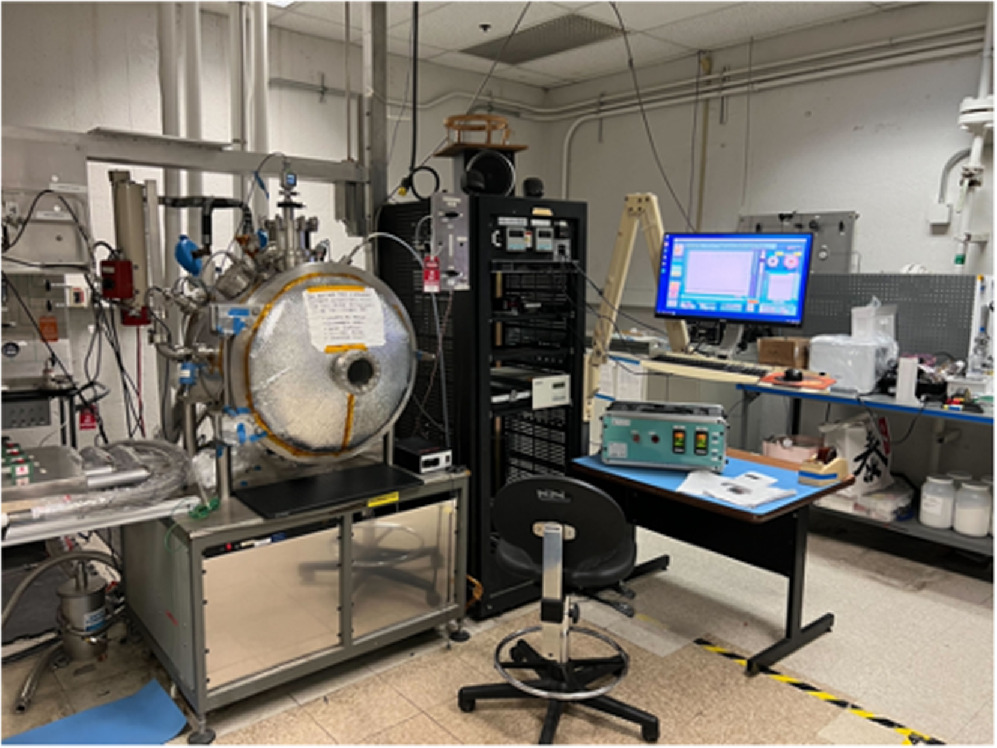
Figure 2. JPL's DUSTIE thermal vacuum chamber.
Download figure:
Standard image High-resolution image2.2. Experimental Protocol
For each of our experiments, we first purged DUSTIE with GN2 for <30 minutes. We then pulled vacuum on the chamber to 1 mbar and flowed LN2 through the cylindrical shroud and cooling plate. The setpoints on the PIDs were set to 88 K so that the simulated "atmosphere" inside the chamber was as cold as possible for our experiments. LabView 2019 data acquisition software was used to monitor temperature via thermocouples placed on the plate and shroud and pressure via a pressure sensor sensitive to Mars polar pressure ranges between 1 and 10 mbar. In the meantime, as the system cooled, we used a Cryopod (Figure 3(a)) to cool our simulant to 88 K, as cooling our 2 cm thick layer of simulant was not possible with just the cooling plate and cold sky in the chamber. Cryopods are small cryogenic carriers, typically used for transport of temperature-sensitive biological material, that cool samples held in a small (17.5 × 18.8 × 7.9 cm) basket suspended above a LN2 bath. We filled a Cryopod basket with a layer of MMS dust supplied by our Extraterrestrial Simulants Team and ensured that it was as level as possible. A ∼2 cm thick layer of MMS dust was used because we required available material to be entrained by sublimating CO2 to form a visible plume. We buried a 5 × 5 cm Kapton strip heater ∼1 cm and three thermocouples between ∼<5 mm and ∼1 cm below the surface. One thermocouple was placed as near to the surface as possible while still being buried, above the edge of the heater; another was between ∼<5 mm and ∼1 cm below the surface but at the edge of the heater; and another was between ∼<5 mm and ∼1 cm below the surface but close to the edge of the basket. We then placed the basket inside the Cryopod carrier and, using a funnel, filled the Cryopod base with LN2 in order to steep the basket in a LN2 bath. We allowed the system to cool for ∼1 hr, topping up the LN2 when cooling rate slowed.

Figure 3. Methods used in each experimental run. Panel (a) shows the cryopod with basket filled with MMS dust and a thermocouple inserted to monitor cooling. Panel (b) shows the cryopod being filled with LN2, with DUSTIE in the background. Panel (c) shows the setup in the chamber just after an experiment has run and the door has opened. CO2 frost coats all internal surfaces and is thicker on shroud and LN2 hoses because these are at ∼88 K owing to LN2 flowing directly through them.
Download figure:
Standard image High-resolution imageWhen the thermocouples showed that the simulant was cooled throughout, we backfilled the chamber with GN2 until internal pressure was at atmosphere, keeping the coolant flowing through the shroud and plate constantly. The door was opened and the basket was quickly placed inside, at the center of the cooling plate, which was covered in Kapton tape apart from the location where the basket would be placed. The door was shut, and immediately the chamber was pumped down again, with the roughing pump at 1 mbar s–1 in order not to blow away the fine dust. When internal pressure reached just below 4 mbar, we closed the pump, keeping the system in static equilibrium. We then activated a webcam and began to flow in CO2 gas through a metal inlet connected to a sponge. The purpose of the sponge was to diffuse incoming CO2 and ensure that we did not blow away fine grains on the surface of our sample. As we were flowing in relatively warm gas, flow was modulated to ensure that the surface of our simulant was within bounds of 130 and 155 K and 4–10 mbar, which was the range for which translucent slab ice was identified to condense in Portyankina et al. (2019). During each experiment, we built up a layer of CO2 ice for between 3 and 5 hr. However, it was not possible to keep layer thickness or ice type consistent between trials for the following reasons: (i) vacuum leaks would sometimes spring, causing us to have to slightly open the pump to run in dynamic equilibrium in order to remain at Mars polar pressure ranges (and due to the long lead time and preparations before an experiment began, it was not feasible to restart when this occurred); (ii) the incoming gas was relatively warm, and this disrupted ice from growing from the center—it was imperative to therefore flow in at a low release pressure of 10 psi; (iii) patches of less translucent ice formed in colder regions (e.g., close to the metal basket edge); and (iv) due to variables such as how quickly the chamber pumped down and timing of emplacement of the basket onto the plate, the starting temperature of the system varied slightly. It was also difficult to constrain how thick the ice was in each case, due to it mostly being translucent. By comparing video from before and after the experiment began, we identified when an ice layer had built over our heater, and at this point we stopped flowing CO2. We then activated the heater.
We explored four heating scenarios for our experiments: (i) one heater at full power left running to observe a plume, (ii) one heater at 20% power left running to observe a plume, (iii) one heater stopped after surface disruption was observed (typically within a minute of turning on the heater), and (iv) two heaters during one experiment at full power, activated one after the other and stopped once the surface was cracked to preserve morphology (Table 1). In the last five trials, we embedded two heaters within the regolith at the same depth as before: one in the previous spot and the other located toward the lower left corner of the basket. The aim here was to investigate whether accumulated ice thickness had any influence on morphology and also to investigate how individual morphologies interacted, as thicker ice deposits tended to accumulate in the lower left corner compared with the center of the basket (with relative thickness assumed based on where we saw ice first start to accumulate). We ran three trials of each single heater experiment and five trials using two heaters.
Table 1. Table of Experimental Trials, Parameters Varied, and Observations
| Trial | No. Heaters | Heater % | Plume | Halo | Spider | Notes |
|---|---|---|---|---|---|---|
| 03/03/23 | 1 | 100 | powerful | yes | erased | channels and pits |
| 03/06/23 | 1 | 100 | powerful | yes | erased | pits |
| 03/08/23 | 1 | 100 | powerful | yes | erased | ... |
| 06/09/23 | 1 | 20 | diffuse | yes | no | ... |
| 03/01/23 | 1 | 20 | diffuse | yes | yes | ... |
| 06/07/23 | 1 | 20 | diffuse | yes | yes | ... |
| 04/11/23 | 1 | 100 | stopped | no | yes | ... |
| 03/07/23 | 1 | 100 | stopped | no | yes | ... |
| 03/08/23 | 1 | 100 | stopped | no | yes | ... |
| 06/09/23 | 2 | 100 | stopped | no | two | ... |
| 06/13/23 | 2 | 100 | stopped | no | two | ... |
| 06/14/23 | 2 | 100 | stopped | no | two | ... |
| 06/15/23 | 2 | 100 | stopped | no | two | ... |
| 06/20/23 | 2 | 100 | stopped | no | two | ... |
Download table as: ASCIITypeset image
After each trial, we slowly backfilled the chamber with GN2 to preserve surface topography. We then stopped LabView and deactivated the webcam. When the chamber door opened, we quickly imaged the resulting morphologies. We then closed the chamber door and allowed CO2 ice that had deposited on the chamber shroud to sublimate overnight. The next day, the chamber was cleaned and liquid water residue was dried before beginning the next experiment.
3. Results
3.1. Stage 1: Forming a CO2 Ice Layer on MMS Dust
For each experiment, translucent CO2 condensed on the surface of the MMS when the surface temperature was kept between 130 and 155 K and the chamber pressure was kept between 4 and 10 mbar (Figure 4(b)). Sparkling CO2 ice crystals would first form across the surface of the regolith, as well as across the walls of the basket and the walls and floors of the chamber. Over the cooled regolith, the CO2 would eventually form a relatively translucent layer, which was difficult to see in real time but was easily identifiable by observing surface albedo shifts within a sped-up video. In some cases, transient patches of "milky" CO2 ice developed; these were easier to identify by eye and were thought to contain a higher density of pore space/cracks.
To avoid the edge effects observed in Mc Keown et al. (2021), we created CO2 ice until we were confident that we had coated the entire surface of MMS with CO2. However, as the surface temperature likely varied across the MMS, due to proximity to the colder aluminum basket edges or to the inlet for the warmer CO2 gas, the ice layer may not have been consistent in thickness or translucency; we could not ascertain these qualities.
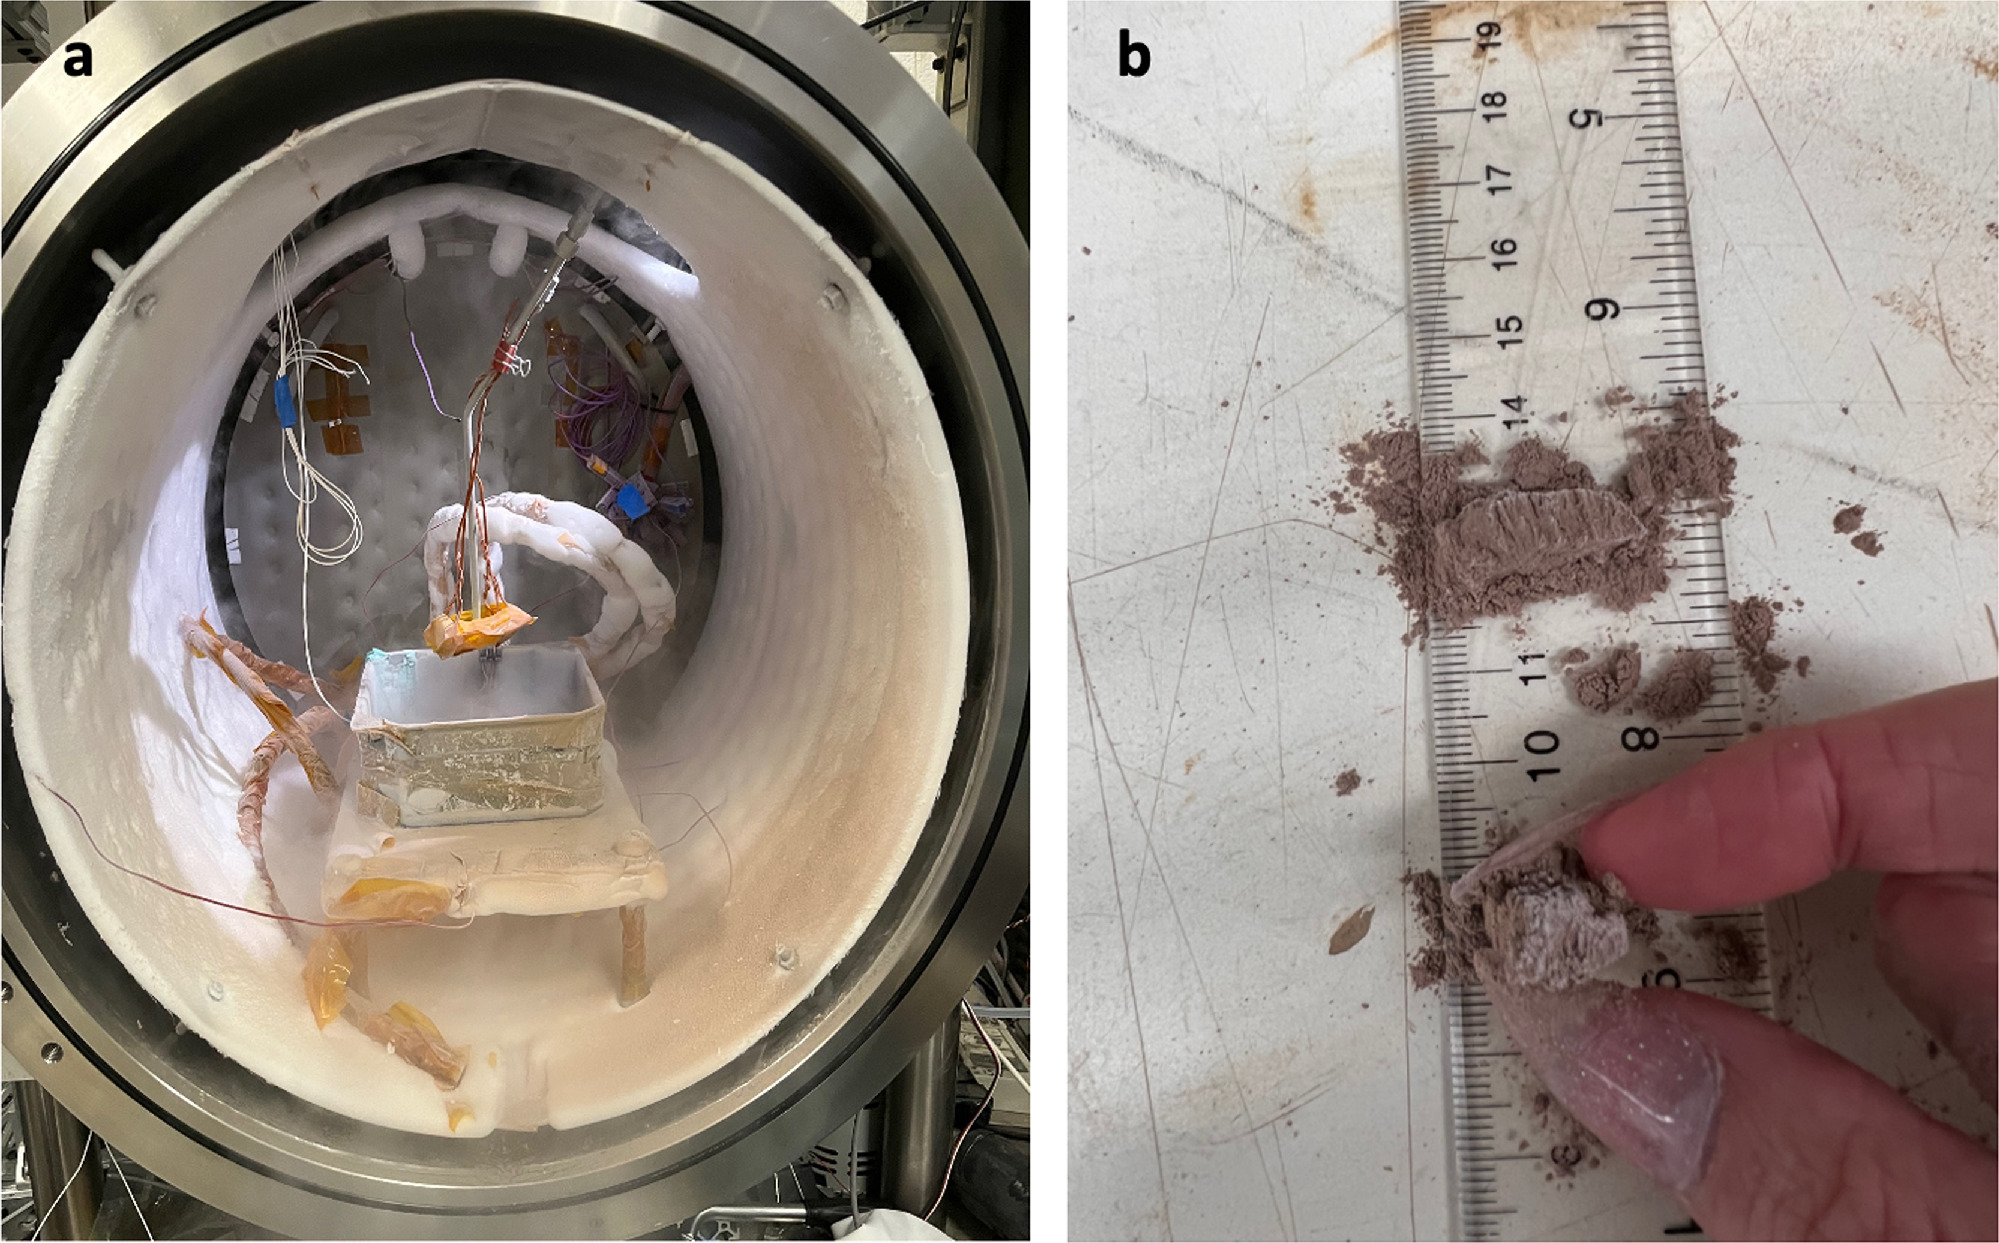
In addition to forming ice over the surface, the CO2 also appeared to have diffused into the regolith, penetrating 5–10 mm into the substrate. This depth is based on the thickness of a cohesive regolith layer, observed after each experiment following complete defrosting, as demonstrated in Figure 5(b). Additionally, after some heater activations, the heater would flap upward, suggesting that ice had sublimated from beneath the heater (Figure 6) that had been buried 1–2 mm beneath the surface.
Figure 4. Schematic indicating each stage of the Kieffer model shown in Figure 2, replicated in our experiments. Panel (a) shows our lab setup. Panel (b) shows Stage 1: CO2 ice condensation. Panel (c) shows plume and spot formation and the formation of spider-like morphologies. Panel (d) shows the remaining morphologies. An animation of this process is available. This real-time animation after plume activity begins shows vigorous plume dynamics with dark ejecta emanating from the surface of our sample and eventual cracking of the surface. The duration of the animation is 9 minutes and 5 s. All animations show recordings taken with a webcam from an upper viewport on the chamber.
(An animation of this figure is available.)
Download figure:
Video Standard image High-resolution imageAs described in Section 2, every caution was taken to ensure that minimal water vapor contaminated our system, but it is possible that a small amount of water may have frozen within the regolith pore space during cooling in the nitrogen bath. However, we confirmed mobility and lack of visible signs of cohesion within the top layer of substrate prior to emplacement in the chamber by probing the surface with a stick and confirming looseness and no solid ice chunks, and so we are confident that the vast majority of ice that created cohesion in the top centimeter of the regolith post-experiment was CO2.
Figure 5. (a) Image showing that the plume had extended to the roof of the chamber, leaving dust deposited over the full right side of the shroud. An animation of this is available. This real-time animation after plume activity begins shows material being ejected from the corner of the heater in the form of a plume from below the surface in a diffuse manner. The plume extends to the roof of the chamber. The duration of the animation is 14 minutes and 20 s. (b) Chunks of consolidated regolith after the chamber was backfilled, showing that CO2 likely diffused at least 5 mm down into the substrate (with minimal concentration of water ice included).
(An animation of this figure is available.)
Download figure:
Video Standard image High-resolution image3.2. Stage 2: Plumes, Spots, and Halos
3.2.1. Plumes
For the first time in the laboratory, plumes were formed when the interface between a CO2 ice layer and Mars regolith simulant was heated, as proposed by the Kieffer model (Kieffer et al. 2006) (Figures 4(c) and 5(a)). However, our method of heat transfer was different to what we expect on Mars in that we did not engender the type of gradual heating expected by insolation receipt and used a small strip heater. In these experiments, the location(s) and number of plumes were stochastic, which was expected since small-scale variation in CO2 ice layer thickness would cause weaker points in the ice. In all cases, the plume began as a subtle ejection of gas and dust and gradually grew more vigorous in activity. During the start of plume activity, we observed small-scale "cracking" of the regolith surface before the clear emanation of dust.
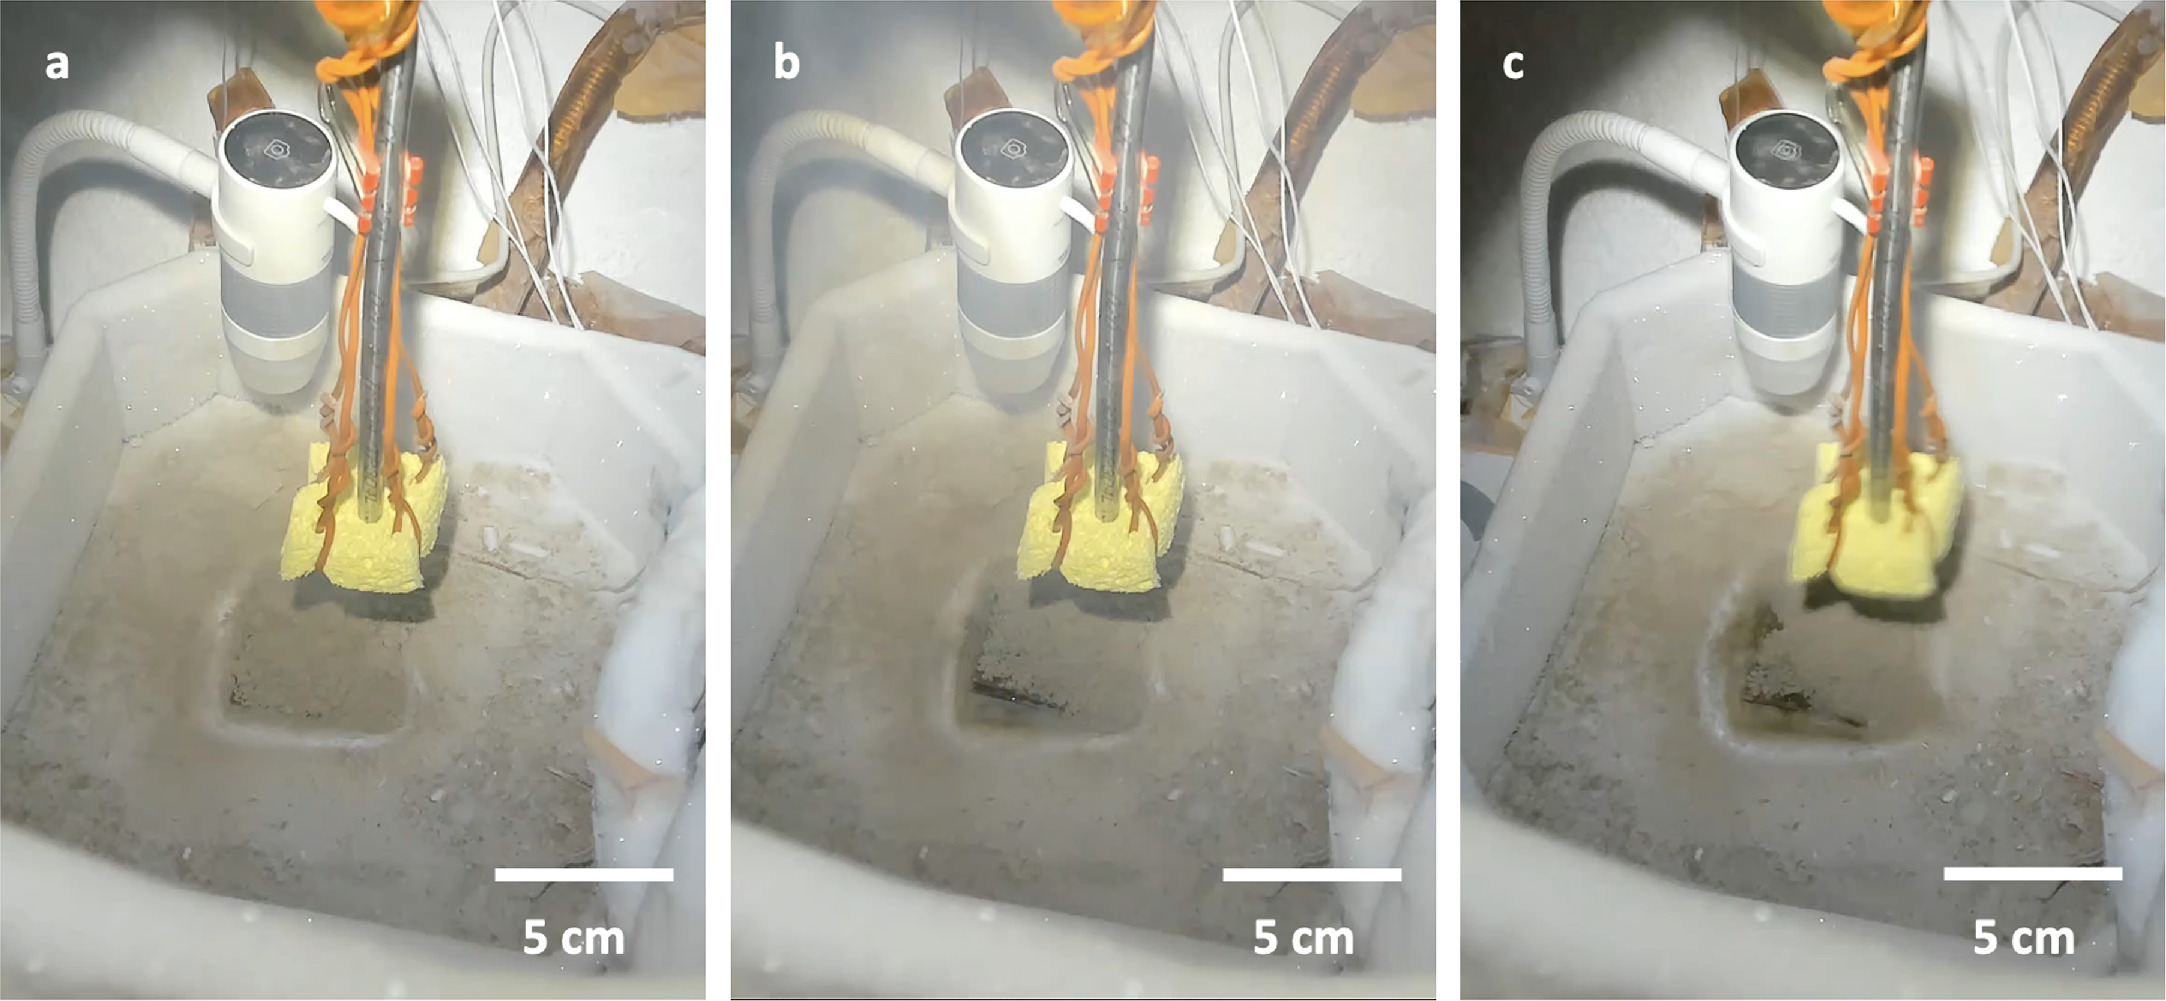
Figure 6. Images of heater flapping upward when activated, indicating that sublimation was occurring beneath it. (a) t = 4 hr, 29 minutes, 02 s before heater lifted up. (b) t = 4 hr, 30 minutes 30 s, at maximum lift of heater. (c) t = 4 hr, 36 minutes, 39 s, when heater flapped down again.
Download figure:
Standard image High-resolution imageFor the first three trials, we observed plume dynamics when the heater was activated at full power (Figure 4). In each case, we ran the heater at 100% for ∼20 minutes. After ∼10–15 s, a relatively dark plume was observed to emanate from a corner of the heater; in some experiments a second plume formed from a different edge of the heater. The plume typically grew in power, in some cases hindered in its vertical stretch only by the top of the chamber shroud, approximately 40 cm above the surface of the MMS dust. Broader cracked patterns developed across the top of the square-shaped heater. Eventually, sufficient material was excavated from above and below the heater by the activity for small pits to form within the regolith above the heater. After the plume had died down, which usually took ∼10 minutes, the heater was stopped and the chamber was backfilled. Inspection of the fully defrosted surface showed that the energetic plume activity had erased any surface cracking or other created topography, via a combination of material ejected in the plume falling back down onto the surface and infalling material into the pit generated by the plume.
So as to investigate the influence of heater power level and to attempt to retain some created topography, three trials were run with the heater activated at 20% power. In these experiments, the plumes took longer to appear, were far less vigorous, and appeared as waving long, dark, standing striations in the chamber "atmosphere" (Figure 5). The lower levels of heat impulse also resulted in smaller, less dense cracks. These cracks were still erased if the heater was left running until the plume naturally ended. For the trials at either power level where the heater was stopped early and thus plume activity was cut short, surface morphologies were preserved.
3.2.2. Spots and Halos
The plume vent, upon first appearance, was a relatively dark spot within the frost as it exposed regolith. After the initial appearance, the vent widened enough to expose the heater, which was much darker than the regolith. Thus, we could not investigate further the appearance of dark spots.
Bright halos (Figures 4(c) and 7) often developed around the heater as the plume advanced. The halo became brighter as the plume activity continued, and it remained visible after plume activity ceased. When the chamber was opened up, the halo was inspected to determine whether its brightness was due to frost-covered material or granular sorting. As the bright material eventually disappeared, there was no change to the surface morphology as the surface completely defrosted, and there was no visible difference between the grains in the halo and the rest of the regolith, we concluded that the halo was bright because of a concentration of frost.
Figure 7. Bright halos observed in each experiment. An animation of their formation is available. This animation shows a bright "ring" gradually growing around the edges of the heater and increasing in brightness over time. The duration of the animation is 13 minutes and 45 s.
(An animation of this figure is available.)
Download figure:
Video Standard image High-resolution imageWe interpret that the halo appeared to be due to deposition of frost-covered dust grains. Due to the plume, these dust grains were lofted into the atmosphere, where, either in the atmosphere or when they fell back down, they served as nucleation sites. CO2 either froze to them and they fell back down, forming a ring shape around the boundary of the heater, or the heat flux around the edges of the heater caused translucent ice to morph into more triangular crystals. The latter possibility seems more likely owing to the placement of the bright frost around the edges of the heater in many cases. Portyankina et al. (2019) identified triangular crystals at lower temperature ranges than those for translucent slab ice. Figure 7 shows an example of an experiment where a plume was allowed to continue and a halo formed in <10 minutes. These temperature conditions were ∼–160°C, which is consistent with the range within which triangular crystals formed for Portyankina et al. (2017b). We infer that the location of the ring provided the right temperature conditions at our pressure ranges of between 2 and 10 mbar for retention of bright, perhaps triangular crystals (Portyankina et al. 2019) of CO2—the same type of crystals that were observed to sparkle around the chamber and over the regolith when CO2 was first condensing. As the frost was concentrated in this deposited ring, it was retained despite proximity to the heater.
3.3. Stage 3: Morphologies Produced by the Simulated Kieffer Model
3.3.1. Pits and Channels
In some cases where the plume was allowed to run continuously, we observed small pits and sinuous channels in the aftermath of activity on the surface of the MMS dust (Figure 8), including beneath the heater when it was lifted up after an experimental run. We interpret these as marking the path of trapped gas conduits escaping from beneath the heater.

Figure 8. Image showing pits and channels that developed when plume activity was investigated. Panel (a) shows a channel that developed at the back of the basket from a location where a plume was operating. Panel (b) shows a pit from a location at the front of the basket where a more vigorous plume was operating. Panel (c) indicates channels discovered below the heater when it was gently lifted up.
Download figure:
Standard image High-resolution image
Figure 9. "Cracked" spider morphologies observed when heaters were stopped after plume activity began.
Download figure:
Standard image High-resolution image3.3.2. "Cracked" Spider Morphologies
Based on the experimental runs where the heater was stopped as soon as surface morphologies were observed to form, we investigated the formation of "cracked," spider-like morphologies (Figures 9 and 4(c)). The activity started with a singular plume, usually at the corner of the heater (a point of weakness), and then a crack developed from the plume, toward the center of the heater. The morphology of these features was different from the morphologies that we expect to form via scouring, based on prior lab studies (Mc Keown et al. 2021) and interpretation of large araneiforms on Mars (Hansen et al. 2011; Hao et al. 2020; Mc Keown et al. 2022), in that they appeared as "cracks" from lateral widening of the regolith as opposed to surface channels, were rectilinear to linear in planform, and did not appear fractal with multiple orders of branching. We hypothesize that the differences are due to the method of heat deposition in these experiments.

Figure 10. Plot showing the proposed formation mechanism for "cracked" spider morphologies (a) in the laboratory and (b) on Mars.
Download figure:
Standard image High-resolution imageIn our experimental setup, it appears that a thin CO2 slab ice layer overlays a thin layer of regolith with pore-filling CO2 ice, which itself overlies a layer of dry regolith (Figure 10(a)). The heater is located very near the bottom of the pore-filling CO2 ice layer. Thus, heat deposition happens on the boundary between the heater and dry regolith/pore-filling CO2 ice, causing a high-pressure gas pocket to form somewhere above the heater (Figure 10(a)). This overpressure acts on the two layers above (pore-filling CO2 ice + slab ice layer), and it will crack them both in the polygonal crack pattern, similar to the cracks that are observed in early spring in the CO2 slab on Mars (Portyankina et al. 2012). The gas will follow along the cracks toward the surface, to escape. However, these cracks may not propagate all the way to the top of CO2 ice; rather, a hole may form through which the plume vents. In this scenario, erosion of icy regolith happens within these newly formed cracks in regolith held together by an icy matrix (Figure 10(a)). At the scale of our lab experiments, as these cracks and the motion of gas occur predominantly within the thin layer of regolith with pore-filling CO2 ice, the cracks are likely to be erased as the ice finishes vigorously subliming from that regolith layer, gardening the surface material and any morphological changes caused by ice-rich regolith cracking.

Figure 11. Plots from an experimental example where the heater was run at full power and the plume was allowed to continue, indicating how the thermocouple closest to the plume at the surface rose in temperature and the pressure spiked slightly. Panel (a) shows temperature from three thermocouples before, during, and after plume activity and subsequent end of experiment where chilling was concluded. Red indicates the lowest thermocouple. Blue and green indicate the thermocouples placed close to the heater just below the surface. Panel (b) shows pressure measurement before, during, and after plume activity and subsequent end of experiment backfilling of the chamber with nitrogen gas. Axes are not aligned owing to zooming in at different scales for pressure and temperature.
Download figure:
Standard image High-resolution image
This is a different process from that what has been, at least so far, described for spider formation on Mars (Piqueux et al. 2003). In that model, a thick slab CO2 ice layer overlays a thin layer of pore-filling CO2 ice that in turn overlays dry regolith (which, relative to the experiment setup, can be considered infinite in depth). Solar energy deposition happens on the boundary between the pore-filling CO2 and slab CO2, and this is where the pocket of high-pressure gas forms. The pressure bends and breaks the CO2 slab; as mentioned above, it can create polygonal cracks in the slab ice itself (Portyankina et al. 2012). The gas predominantly moves toward these vent(s) along the boundary between the CO2 slab ice and the frozen regolith, eroding dendritic channels into the loose regolith. As the regolith lies at the lower boundary of the area of gas motion rather than in the realm of gas motion, these channels are preserved after the activity completes.
To summarize the proposed difference: if the regolith/substrate that is being eroded is embedded into the ice layer around and above the gas conduits, the gas escapes through "cracked" morphologies; if the eroded regolith is below the gas conduits, then dendritic shapes are carved out.
While acknowledging the scale differences, if the mechanism that we observed in the lab were to occur on Mars, then it suggests that sunlight would (a) penetrate overlying translucent slab ice and reach ice-rich substrate, warming at the boundary and causing a combination of cracking and surface scouring, depending on energy flux; (b) reach ice-rich terrain that is not covered in slab ice, warming it gradually to cause cracking; or (c) as suggested by Aharonson et al. (2004), stored heat in high thermal inertia terrain could transfer upward, first causing cracking within the top layer of ice-rich regolith and then forming "early" appearances of fans and spots. Due to the observation that this cracking in the laboratory is caused by heat and induced pressure from below the overlying slab and within the ice-rich regolith, we propose that the third scenario is most likely. Further temporal monitoring of fan/spot activity and reconciliation of this timing with corresponding sub-slab morphologies combined with thermal inertia studies, as well as a comparison of the morphologies formed using a solar simulator directed on a layer of thick ice, are needed to further elucidate whether a process similar to that which we observed in the laboratory is plausible for Mars. If such a process were to occur on Mars, certain morphologies may then provide insight as to whether there is ground ice within the topmost layer of substrate, whether composed of CO2 or H2O.
4. Discussion
4.1. Implications of Laboratory Experiments for the Spider Creation Process on Mars
We have described in this paper how CO2 phase-change dynamics proposed to modify the Martian surface today can be re-created in a thermal vacuum laboratory setting. We observed a range of dynamics and morphologies that provide empirical insight into the feedback between the Kieffer process and observed surface change. Based on those results, we extend the interpretation of Martian features and their formative environment.
4.1.1. Kieffer Model Stage 1: Seasonal Polar Cap Deposition
We have successfully replicated in the laboratory Stage 1 of the Kieffer model: condensing CO2 onto a thick layer of granular material. For our laboratory experimental conditions, we observed that CO2 diffuses into fine (<150 μm) MMS dust substrate down to at least 5 mm while forming a thin, conformal layer on top of this frozen layer of regolith. This consistently occurred as long as the pressure and temperature conditions identified by Portyankina et al. (2019) for the formation of CO2 slab ice were maintained, despite experiments having slightly different CO2 flow rates and sometimes varying within an experiment, including a long pause as the gas canister needed to be swapped. It is not clear what is the depth of seasonal CO2 ice penetration into regolith on Mars. However, our tests show that pore-filling ice may influence the process of spider formation and retention and thus needs to be considered.
Efforts to create a measurably thick layer of frost were hampered by coolant availability and ensuring that we did not stress the coolant venting system, but the formation of an isolated and energetic plume indicates that the layer was thick enough to hold a building gas reservoir. This frost layer was translucent and visibly different from the "sparkling" frost crystals that would initially form.
Our observations suggest that an ice slab layer does not need to be that thick to serve as an impermeable layer and be able to withstand rising pressure. Thus, the formation of jets and their height may depend much more on the quality and purity of the ice rather than ice thickness. Additionally, as typical Martian wintertime pressure and temperature conditions are expected to fall within the range where we were forming slab ice, our experiments show that slab CO2 ice is likely to form over at least Martian dust grains (< 150 μm) and also is likely to diffuse into the topmost layer of the regolith. Further studies using a wider range of discrete grain size ranges would be needed to investigate how ice deposition modes vary with grain size, as well as how grain size may influence the plume dynamics and any morphologies produced.
4.1.2. Kieffer Model Stage 2: CO2 Dynamic Sublimation
We also successfully simulated Stage 2 of the Kieffer model: forming plumes, spots, and halos. When heat was initiated at the interface between the substrate and conformal, condensed CO2 ice, we formed plumes in the laboratory. As expected owing to differences in heat flux, energetic plumes reaching the ceiling of the chamber were formed when heaters were activated at full power, and more diffuse, gradually growing plumes formed for 20% power.
The spots and halos, as expected, disappeared as the surface completely defrosted, while the cracks were retained as long as plume activity was not too vigorous (which we elaborate on below). This supports the base hypothesis from the Kieffer model that this "zoo" of features are all formed owing to activity during eruptive CO2 ice sublimation.
4.1.3. Kieffer Model Stage 3: Spider Formation on Mars
Finally, we may have simulated Stage 3 of the Kieffer model: forming spider-like morphologies, though mostly through a mechanism that differs from the traditional Kieffer model. Our plumes created crack morphologies that appeared to be driven by sublimation of interstitial ice within the regolith, rather than scouring of gas within the substrate-frost interface (as was proposed by Piqueux et al. 2003 for spider formation). This activity matches better with the types of processes discussed by Hao et al. (2020) and Pilorget & Forget (2016) that invoke a feedback with permeability and porosity and CO2 diffusion into regolith pore spaces, respectively. Similar models have been proposed for patterned ground at high latitudes on Mars (Mangold 2005; Levy et al. 2009), citing thermal stress as responsible for polygonal or cracked patterns in the substrate.
Overall, we conclude that the erosion by active CO2 jets might be more complex than the original Kieffer model describes, and, beyond spiders, it may contribute to formation of other typical Martian morphologies like polygonal terrains. Further study is needed to determine whether active dendritic troughs (Portyankina et al. 2017b) or sand furrows (Bourke & Cranford 2011) may form on present-day Mars via this mechanism. Additionally, in the lab these features were often erased, with preservation achieved only when (i) diffuse plumes operated and (ii) plume activity was abruptly halted. Thus, quantitative characterization of plume strength, along with duration, is needed to estimate the potential modification of such cracks and correlate with remnant geomorphology.
4.2. Considerations for New Investigations
Below we describe the types of future efforts and measurements that would most advance our understanding, via modeling, laboratory experiments, or potentially even an in situ investigation on Mars.
4.2.1. Seasonal Polar Cap Deposition
The pressure and temperature constraints outlined in Portyankina et al. (2019) seem to be sufficient within the lab setting for prompting CO2 slab ice formation, i.e., changes to CO2 flow rates and duration of the experiment influence the rate of slab ice formation, but not its creation. This is encouraging for alternative laboratory experiment setups and implies a robustness to these conditions within the Martian environment. We also showed for a thick (∼2 cm) layer of MMS that CO2 ice will deposit first within the pore spaces of cold regolith and then coat over the surface as translucent slab ice.
However, with these first experiments, we can only report surface frost formation and diffusion for simulant grains <150 μm, and it is unclear to what extent this process may occur for different mineralogies or grain size distributions. Further investigation is needed to identify the exact granular properties that enable a CO2 ice layer to form.
It is also not clear whether the heater depth influenced the depth to which CO2 diffused into the substrate. Thus, an open question remains about the depth to which the CO2 ice may infiltrate the substrate, via diffusion, and what controls that depth. Future experiments could aim to investigate frost formation over and within substrate of different grain sizes and types. Additionally, acquiring a thermal profile of the top 1 to a few centimeters would be beneficial in the lab. The same type of thermal profile, along with characterization of grain size range and roughness, would be important within in situ investigation of frost formation on Mars.
Achieving the correct conditions to build a thick layer of CO2 on a thick, homogeneously cooled layer of regolith remains extremely challenging. Condensing our layer of CO2 ice on a thick layer of MMS dust was only possible by having a small chamber (but large enough to contain a thick sample of MMS) with a cylindrical shroud that could cool the sky, as well as using a significant amount of coolant. If the sky is not cold enough, then the top layer of regolith can warm beyond the CO2 frost point; this in turn causes much of the injected CO2 to freeze onto the cold shroud rather than onto the regolith. We targeted building CO2 onto our MMS layer by initially putting the CO2 gas outlet close to the regolith surface, but incoming warm CO2 quickly heated the surface and prevented the frost from forming in that region. Even with the outlet placed farther from the surface, we needed to carefully modulate flow so as to remain at the temperature ranges where translucent CO2 condenses (Portyankina et al. 2019). Chilling the line of incoming CO2 gas and connecting the chamber to LN2 plumbing instead of individual dewars could increase the efficacy of future experiments.
While insights into the processes shaping the Martian surface may be gleaned by reconciling larger-scale models with our laboratory observations, we caution that our observations are limited by the conditions needed to condense CO2. In particular, the MMS regolith simulant needed to be cooled throughout, which required cooling from the bottom via the LN2 cooling plate. The scenario on Mars is different, with the CO2 ice in vapor equilibrium with the atmosphere and that atmospheric cooling causing the surface to be cold enough to condense CO2 as ice.
Finally, on Mars, interstitial water ice may be found across some terrains (Leighton & Murray 1966; Mellon & Jakosky 1993; Schorgofer et al. 2004) and may also affect the extent to which CO2 diffuses into the substrate. This may constrain the locations where CO2 can sublimate from within regolith on Mars, although it is plausible that cracks may also form by H2O sublimation (Mangold 2005). Future experiments involving a broader range of grain sizes and frozen water ice within regolith should seek to explore this parameter space, enabling reconciliation of these relationships with remote-sensing imagery in order to understand local substrate properties within regions where spiders do (or clearly do not) form on Mars.
4.2.2. Dynamic CO2 Sublimation on Mars
A key limitation of our study is that our heaters were unable to simulate the type of gradual and top-down heating achieved by natural sunlight. Additionally, a more quantified control over the creation of diffuse or energetic plumes would be helpful. On Mars, the plume strength has been thought to be primarily influenced by ice thickness, but CO2 frost type and imperfections/porosity of that ice may be key controls on the strength of the overlying ice layer. Thus, characterizing these qualities of the overlying ice, in addition to its thickness, would be important measurements to collect in the laboratory or on Mars. Additionally, a measurement of the plume strength and duration could be integrated to constrain the amount of gas that built up beneath the ice layer and connected to the extent of disturbed/excavated material.
In the lab, spots were seen at the location of plume activity close to the crack morphologies. In some cases, where the heat influx continued long enough, bright halos were found around the vent in the substrate created by the plume. We interpreted these halos as frost that either nucleated on ejected dust grains, falling back down from the atmosphere in the chamber, at the right temperature and pressure ranges for sparkling CO2 crystals to form, or formed at the exact temperature and pressure found at the edge of the heater. Our temperature data from near the heater show that the substrate was around –160°C when the halos were forming. Our pressure readings were from the top of the chamber and were not close enough to the plume to ascertain the pressure at the vent. However, from some experiments where the plume top reached close to the pressure sensor, we note that pressure increased by ∼ 3 mbar (Figure 11(b)). Bright halos on Mars have been suggested to form via a variety of processes, including (i) sinking through the ice overburden (Pommerol et al. 2011), (ii) the downward flow of gas produced by drag effects from particles falling from the jet (Thomas et al. 2011), (iii) metamorphism of the CO2 slab via diurnal flexing (Kieffer 2007), and (iv) adiabatic cooling of gas spewing from the jets producing CO2 frost, which settles on the surface of the ice downwind (Titus et al. 2007). The surface ice in our experiments was not sufficiently thick for sinking dust grains to be responsible for the halos, and due to vast scale differences, we cannot comment on the implications of our results for drag effects or slab metamorphism. However, the fourth scenario may explain our observations of frost forming in this region. To understand the environments where we observe bright halos on Mars, future experiments or an in situ investigation could use a thermal camera to map surface temperatures as the plume operates and correlate with the presence of halos.
4.2.3. Spider Formation
Future experiments with thicker top ice layers will be needed to explore whether the "traditional" Kieffer model with surface scouring of dendritic troughs, as observed in Mc Keown et al. (2021), will occur. However, future in situ measurements are needed to confirm whether and to what extent CO2 may diffuse into the top layer of substrate on Mars. This work may motivate future modeling efforts to apply our small-scale observations to the relatively large scales (∼tens of meters) observed for sand furrows and dendritic troughs on Mars.
If sublimation from within the regolith is a significant process to form the observed features on Mars, it appears that preservation of surface morphologies requires less vigorous plume dynamics. Thus, timing and longevity of plume activity may be key controls on where spiders, furrows, and dendritic troughs can form and be retained beyond the surface completely defrosting. These factors will be influenced by a combination of ice thickness/quality, translucency, and slope/aspect. Such factors can be explored on a broad scale with existing orbital observations of areas containing spider, dendritic trough, and sand furrow locations on Mars, but better constraints would be derived with the higher resolution and exact timing that can only be acquired with in situ measurements. Efforts to determine these parameters in the lab could guide investigation methods on Mars. Additionally, initial correlative analyses could be completed within small-scale lab studies or broad surveys of these Martian features.
Finally, morphometric measurements of the cracked morphologies created in the lab could be compared with those seen in the much larger spider features on Mars. Insight from these empirical investigations can guide numerical modeling, to determine whether the small-scale activity and features created in the lab are directly analogous to those on Mars.
5. Conclusion
In this work, we simulated—in a single experiment—the three main stages of the Kieffer model for Mars. On the small scale, we (i) condensed CO2 ice on a ∼2 cm thick layer of MMS dust simulant, (ii) generated plumes and formed spots and frost halos by heating the regolith a few millimeters below the surface and (iii) observed "cracked" spider-like morphologies. These experiments support the general structure of the Kieffer model, and our work provides detailed looks into the specific processes at work to create the "zoo" of features observed on Mars. The main conclusions from the experiments described above are as follows:
- 1.The Kieffer model remains a feasible explanation for the creation of spiders and the associated "zoo" of seasonal features on Mars.
- 2.Both slab CO2 and diffused interstitial CO2 ice are shown to form under the average pressure and temperature ranges expected in Martian polar regions.
- 3.The overlying CO2 frost layer does not need to be very thick to provide enough strength to withstand building pressure from sublimating interstitial ice as long as CO2 is in slab form.
- 4.The erosion part of the Kieffer model may require additional and more diverse processes and lead to the creation of a range of forms of permanent features, beyond dendritic spiders. For example, cracking may be an additional process involved in the formation of "cracked" dendritic trough morphologies on Mars.
Our experiments were limited by scale, as well as by the methods we use to cool or heat our sample (i.e., in both cases, from below). As outlined, further experiments with adjustments to address these limitations would further refine our understanding of the constraints for the dynamics occurring on Mars. Additionally, comprehensive numerical models of spider formation by surface scouring versus sublimation from within the regolith would enable extrapolation of our observations to the scales observed on Mars. In situ measurements of time evolution of active dendritic troughs and the CO2 condensation–sublimation cycle on Mars, including the specific measurements outlined here, are also needed to fully understand the nuances of the Kieffer model and its "zoo" of features.
Acknowledgments
The research was carried out at the Jet Propulsion Laboratory, California Institute of Technology, under a contract with the National Aeronautics and Space Administration (80NM0018D0004). © 2024. All rights reserved. We thank JPL's cryogenics team, Chris Del Cid, Kirstie Belmonte, and Greg Ackerman, for the timely and plentiful supply of LN2 and for sharing their expertise regarding our thermal regulation system. We thank JPL's propulsion group for help with Pressure Vessel System safety and gas regulation, in particular Jim Curran and Rob Williams. We acknowledge the technical help and expertise shared with us in maintaining and upgrading the DUSTIE chamber for our experiments, from Tom Reynoso, Kenneth Glazebrook, Wade Smith, Jeff Foster, Errin Dalshaug, and David McCrary.