NASA (Posts tagged NOAA)

1.5M ratings
277k ratings

See, that’s what the app is perfect for.

Sounds perfect Wahhhh, I don’t wanna

Comin’ in Hot: Seven Things to Know About our New Heat Shield

What goes up, must come down, and from space, without burning up in an atmosphere. That’s why we’re pumped for the Low-Earth Orbit Flight Test of an Inflatable Decelerator, or LOFTID. Launching on Nov. 1, 2022, with the National Oceanic and Atmospheric Administration’s (NOAA) Joint Polar Orbiting Satellite System-2 (JPSS-2) mission, this technology demonstration marks the next step in advancing an innovative heat shield design that could one day be used to land heavy payloads – including humans – on Mars!

Animated GIF of an animation of mission highlights for the Low-Earth Orbit Flight Test of an Inflatable Decelerator (LOFTID). We see the upper stage of the ULA Atlas V rocket reorient and position LOFTID for entry into Earth's atmosphere. The re-entry vehicle spins and separates from the upper stage. The inflated heat shield is scene descending toward Earth and motion lines behind the technology indicate the transmission of data during its flight.ALT

Here are seven things to know about this innovative re-entry system: 

1. LOFTID is the first-ever in-orbit test of this technology. 

Inflatable heat shields, called Hypersonic Inflatable Aerodynamic Decelerators (HIADs), have been in the works for more than a decade. In 2012, the third of the Inflatable Re-entry Vehicle Experiments (IRVE) launched on a suborbital sounding rocket from the Wallops Flight Facility, demonstrating a 3-meter (10-foot) diameter inflatable heat shield.

Engineers at NASA's Langley Research Center are standing next to an orange stack of inflated test rings atop a stand during the final test of the inflation system in Jan. 2022. The inflation system is one component of the LOFTID re-entry vehicle demonstration.ALT

But the LOFTID re-entry vehicle, at 19.7 feet (6 meters) in diameter, will be the largest blunt body aeroshell to ever go through atmospheric entry. Designed to withstand temperatures as high as 2900°F (1600°C), this first-ever in-orbit test of this technology will prove if it can successfully slow down large payloads – such as crewed spacecraft, robotic explorers, and rocket components – enabling them to survive the heat of re-entry at planetary destinations with an atmosphere.

2. You can find out how this tech works in real-time.  

LOFTID is unique in that all operations will happen within a few hours of launch. After the JPSS-2 satellite safely reaches orbit, the LOFTID vehicle will separate from the upper stage of the Atlas V rocket and begin re-entry into Earth’s atmosphere. If all goes as planned, the technology will help the vehicle decelerate from hypersonic (more than 25 times faster than the speed of sound) down to subsonic flight, less than 609 miles per hour for a safe splash down and recovery from the Pacific Ocean. 

While in flight, engineers at NASA’s Langley Research Center will receive location data every 20 seconds and onboard sensors and cameras will record more comprehensive data about the technology’s performance. You can get a behind-the-scenes look at Langley’s Flight Mission Support Center where the LOFTID project team will be monitoring the flight test at NASA.gov/live following the launch.

Graphic of the LOFTID Mission Timeline and Flight Path illustrating the important milestones in the technology demonstration. The background imagery on the left is the launch from Vandenberg Space Force Base in California. From the launchpad, the stages of the launch sequence and separation are identified by different icons and timelines starting with the booster separation, and moving through payload spacecraft separation, the aeroshell inflation and the Centaur upper stage orientation and spin. We see a rendering of the heat shield separating at L+70 minutes and LOFTID beginning its descent toward Earth. We see LOFTID's parachute deployed and its splashdown in the Pacific Ocean depicted at the L+125 minute mark.ALT

3. A lemon-sized capsule ejected into the Pacific Ocean will hold key flight data. 

The LOFTID re-entry vehicle will record both sensor and camera data during its flight. The data will include the temperatures and pressures experienced by the heat shield and will illustrate how well the technology performed during the demonstration.

Although the goal is to retrieve the LOFTID re-entry vehicle after it splashes down in the Pacific Ocean, the team wanted a back-up option just in case they can’t recover it. Enter the tiny yellow package called an ejectable data module (EDM) which will also record flight data. The EDM will be released from the spacecraft at an altitude of about 50,000 feet. It will free fall into the Pacific Ocean off the coast of Hawaii and should land within 10 miles of the spacecraft’s splash down location. A recovery team, that has practiced hide-and-seek of the EDM on land and sea, will use GPS to search an approximately 900-mile area of the Pacific Ocean to find their “lemon.”

Four men are pictured wearing life vests aboard a U.S. Army Landing Craft Utility boat as they conducted a water recovery test of the ejectable data module for the Low-Earth Orbit Flight Test of an Inflatable Decelerator (LOFTID).ALT

4. This heat shield packs a punch. 

Although NASA has historically relied on rigid aeroshells, parachutes, and retro-propulsion (rockets) to decelerate people, vehicles, and hardware during entry, descent, and landing operations, a benefit of inflatable heat shields is that they take up less space in a rocket, allowing more room for other hardware or payloads. LOFTID’s aeroshell has been folded and tightly packed down to 4 by 1.5 feet for launch and stacked in the United Launch Alliance (ULA) Atlas V rocket payload fairing.

Close up of the United Launch Alliance Atlas V payload fairing containing the National Oceanic and Atmospheric Administration’s (NOAA) Joint Polar Satellite System-2 (JPSS-2) as it arrived at the vertical integration facility at Space Launch Complex 3 at Vandenberg Space Force Base (VSFB) in California. We see the hand-painted JPSS-2 mission patch on the top of the fairing, the NOAA and NASA logos beneath, and then LOFTID mission patch underneath.ALT

5. LOFTID is dedicated in honor of one of its innovators.  

LOFTID was developed as a partnership with ULA and is dedicated to the memory of Bernard Kutter, ULA manager of advanced programs, who passed away in August 2020. Kutter was instrumental in advancing the inflatable heat shield design and developing the plan to test the system on an Atlas V rocket. He was an advocate for both space technology and expanding access to space. Kutter’s NASA and ULA counterparts agree that LOFTID is unlikely to have made it to space without his vision and passion.

6. LOFTID is made of tough stuff. 

Synthetic fibers make up the inflatable structure, braided into tubes that are, by weight, 10 times stronger than steel. The tubes are coiled so that they form the shape of a blunt cone when inflated. The thermal protection system that covers the inflatable structure can survive searing entry temperatures up to 2,900 degrees Fahrenheit. Researchers used the same heat-shielding materials to create a fire shelter prototype for firefighters battling forest fires.

7. You can make your own LOFTID Halloween costume! 

Still looking for an out-of-this world Halloween costume? With a few commonly found materials, like orange pool noodles and duct tape, you can create your own LOFTID costume. However, we make no promises of protecting or slowing you down from becoming the life of the party.

In front of the NASA worm logo on the stone wall outside the Mary W. Jackson NASA Headquarters building in Washington, is a woman wearing the make-your-own LOFTID Halloween costume. She wears black long-sleeved shirt, gloves and pants, and has yellow suspenders holding up a stack of orange pool noodles in the shape of rings meant to represent the inflatable heat shield technology.ALT

Follow @NASA_Technology for the latest updates on LOFTID. Don’t miss our live coverage leading up to launch from the Vandenberg Space Force Base in California. The NASA Edge JPSS-2 Tower Rollback Show airs live on NASA TV and YouTube on Tuesday, Nov. 1 at 12 a.m. EDT, and NASA TV live launch coverage will begin at 4:45 a.m. EDT. 

Make sure to follow us on Tumblr for your regular dose of space!

LOFTID NOAA NASA spaceblr space technology tech Youtube technology

How Climate Change Showed Up in 2021

2021 was tied for the sixth-hottest year since modern record keeping began. We work together with the National Oceanic and Atmospheric Administration to track temperatures around the world and study how they change from year to year.

image

For decades, the overall global temperature has been increasing because of human activities. The last decade has been the warmest on record. Each individual year’s average temperature, however, can be affected by things like ocean circulation, volcanic eruptions, and specific weather events.

For instance, last year we saw the beginning of La Niña – a pattern of cooler waters in the Pacific – that was responsible for slightly cooling 2021’s average temperature. Still, last year continued a long-term trend of global warming.

Globally, Earth’s temperature in 2021 was nearly 2°F warmer than the late 19th Century, for the seventh year in a row.

image

The Record

Studying 142 Years

Since 1880, we can put together a consistent record of temperatures around the planet and see that it was much colder in the late-19th century. Before 1880, uncertainties in tracking global temperatures are larger. Temperatures have increased even faster since the 1970s, the result of increasing greenhouse gases in the atmosphere.

Tracking Millions of Individual Observations

Our scientists use millions of individual observations of data from more than 20,000 weather stations and Antarctic research stations, together with ship- and buoy-based observations of sea surface temperatures, to track global temperatures.

image

Reviewing Multiple Independent Records

Our global temperature record – GISTEMP – is one of a number of independent global temperature records, all of which show the same pattern of warming.

image

The Consequences

Everywhere Experiences Climate Change Differently

As Earth warms, temperature changes occur unevenly around the globe. The Arctic is currently warming about four times faster than the rest of the planet – a process called Arctic amplification. Similarly, urban areas tend to warm faster than rural areas, partly because building materials like asphalt, steel and concrete retain heat.

image

Droughts and Floods in Warmer Weather

More than 88% of the Western US experienced drought conditions in 2021. At the same time, communities in Western Europe saw two months’ worth of rain in 24 hours, breaking records and triggering flash floods. Because a hotter climate means more water can be carried in the atmosphere, areas like the Western US suffer drought from the increased ‘thirstiness’ of the atmosphere, while precipitation events can become more extreme as the amount of moisture in the atmosphere rises.

image

Sea Levels Continue to Rise

Melting ice raises sea levels around the world, as meltwater drains into the ocean. In addition, heat causes the ocean water to expand. From 1993 to today, global mean sea level has been rising around 3.4 millimeters per year. In 2021, sea level data from the recently launched NASA/ESA Sentinel-6 Michael Freilich mission became available to the public.

image

There is Hope

“This is not good news, but the fact that we are able to track this in real time and understand why it’s changing, and get people to notice why it’s changing and how we can change things to change the next trajectory, that gives me hope. Because we’re not in the dark here. We’re not the dinosaurs who are unaware the comet is coming. We can see the comet coming, and we can act.” – Dr. Gavin Schmidt, director of NASA GISS, where the global temperature record is calculated

Make sure to follow us on Tumblr for your regular dose of space!

NASA climate home planet Earth climate change NOAA Arctic global warming climate science ocean sea drought science historyblr

One Hot Year after Another

Globally, 2020 was the hottest year on record, effectively tying 2016, the previous record. Overall, Earth’s average temperature has risen more than 2 degrees Fahrenheit since the 1880s.

image

Temperatures are increasing due to human activities, specifically emissions of greenhouse gases, like carbon dioxide and methane. 

Heat and the energy it carries are what drive our planet: winds, weather, droughts, floods, and more are expressions of heat. The right amount of heat is even one of the things that makes life on Earth possible. But too much heat is changing the way our planet’s systems act.

My World’s on Fire

Higher temperatures drive longer, more intense fire seasons. As rain and snowfall patterns change, some regions are getting drier and more vulnerable to damage, setting the stage for more fires.

image

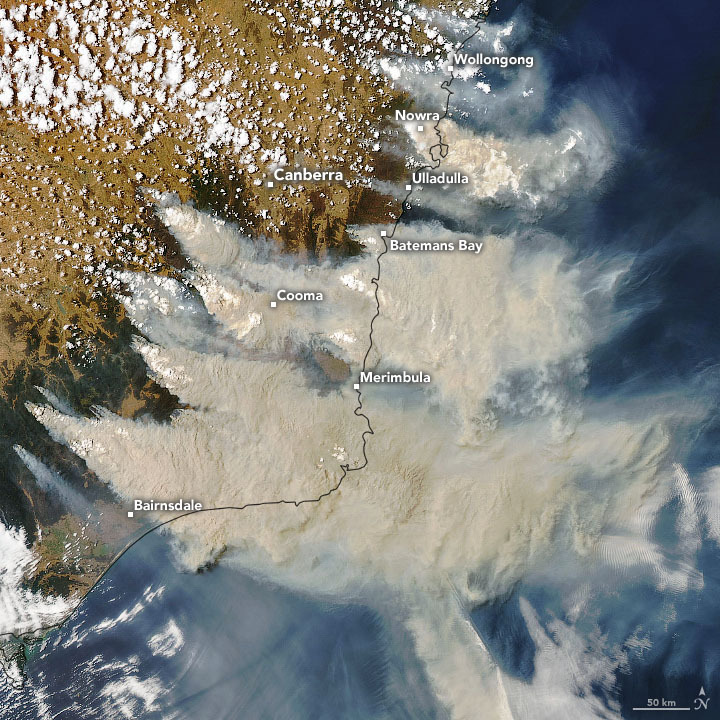
2020 saw several record-breaking fires, both in Australia in the beginning of the year, and in the western U.S. through northern summer and fall. Smoke from fires in both regions reached so high into the atmosphere that it formed clouds and continues to travel around the globe today.

image

In the Siberian Arctic, unusually high temperatures helped drive at least 19 fires in the region. More than half of them were burning peat soil – decomposed organic materials – that stores a lot of carbon. Peat fires release vast amounts of carbon into the atmosphere, potentially leading to even more warming.

image

The Water’s Getting Warm

It wasn’t just fire seasons setting records. 2020 had more named tropical storms in the Atlantic and more storms making landfall in the U.S. than any hurricane season on record.

image

Hurricanes rely on warm ocean water as fuel, and this year, the Atlantic provided. 30 named storms weren’t the only things that made this year’s hurricane season notable.

image

Storms like Eta, Delta, and Iota quickly changed from smaller, weaker tropical storms into more destructive hurricanes. This rapid intensification is complicated, but it’s likely that warmer, more humid weather – a result of climate change – helps drive it.

image

The Ice Is Getting Thin

Add enough heat, and even the biggest chunk of ice will melt. That’s true whether we’re talking about the ice cubes in your glass or the vast sheets of ice at our planet’s poles. Right now, the Arctic region is warming about three times faster than the rest of our planet, which has some major effects both locally and globally.

image

This year, Arctic sea ice hit a near-record low. Sea ice is actually made of frozen ocean water, and it grows and thaws with the seasons, typically reaching an annual minimum extent in September.

image

Warmer ocean water led to more ice melting this year, and 2020’s annual minimum extent continued a long trend of shrinking Arctic sea ice extent.

A Long Trend

We study Earth and how it’s changing from the ground, the sky, and space. Using data from sensors all around the planet, we calculate the global average temperature, working with our partners at NOAA.

Many other organizations also track global temperature using their own instruments and methods, and they all match remarkably well. The last seven years were the hottest seven years on record. Earth is getting warmer.

image

We also study the effects of increasing temperatures, like the melting sea ice and longer fire seasons mentioned above. Additionally, we can study the cause of climate change from space, with a bird’s eye view of increasing carbon in the atmosphere.

image

The planet is changing because of human activities. We’re working together with other agencies to monitor changes and understand what this means for people in the future.

Make sure to follow us on Tumblr for your regular dose of space: http://nasa.tumblr.com.

NASA climate home planet Earth climate change fire hurricane NOAA Arctic australia climate science

Tracking the Sun’s Cycles

Scientists just announced that our Sun is in a new cycle.

Solar activity has been relatively low over the past few years, and now that scientists have confirmed solar minimum was in December 2019, a new solar cycle is underway — meaning that we expect to see solar activity start to ramp up over the next several years.

image

The Sun goes through natural cycles, in which the star swings from relatively calm to stormy. At its most active — called solar maximum — the Sun is freckled with sunspots, and its magnetic poles reverse. At solar maximum, the Sun’s magnetic field, which drives solar activity, is taut and tangled. During solar minimum, sunspots are few and far between, and the Sun’s magnetic field is ordered and relaxed.

image

Understanding the Sun’s behavior is an important part of life in our solar system. The Sun’s violent outbursts can disturb the satellites and communications signals traveling around Earth, or one day, Artemis astronauts exploring distant worlds. Scientists study the solar cycle so we can better predict solar activity.

image

Measuring the solar cycle

Surveying sunspots is the most basic of ways we study how solar activity rises and falls over time, and it’s the basis of many efforts to track the solar cycle. Around the world, observers conduct daily sunspot censuses. They draw the Sun at the same time each day, using the same tools for consistency. Together, their observations make up the international sunspot number, a complex task run by the World Data Center for the Sunspot Index and Long-term Solar Observations, at the Royal Observatory of Belgium in Brussels, which tracks sunspots and pinpoints the highs and lows of the solar cycle. Some 80 stations around the world contribute their data.

image

Credit: USET data/image, Royal Observatory of Belgium, Brussels

Other indicators besides sunspots can signal when the Sun is reaching its low. In previous cycles, scientists have noticed the strength of the Sun’s magnetic field near the poles at solar minimum hints at the intensity of the next maximum. When the poles are weak, the next peak is weak, and vice versa.

Another signal comes from outside the solar system. Cosmic rays are high-energy particle fragments, the rubble from exploded stars in distant galaxies that shoot into our solar system with astounding energy. During solar maximum, the Sun’s strong magnetic field envelops our solar system in a magnetic cocoon that is difficult for cosmic rays to infiltrate. In off-peak years, the number of cosmic rays in the solar system climbs as more and more make it past the quiet Sun. By tracking cosmic rays both in space and on the ground, scientists have yet another measure of the Sun’s cycle.

image

Since 1989, an international panel of experts—sponsored by NASA and NOAA—meets each decade to make their prediction for the next solar cycle. The prediction includes the sunspot number, a measure of how strong a cycle will be, and the cycle’s expected start and peak. This new solar cycle is forecast to be about the same strength as the solar cycle that just ended — both fairly weak. The new solar cycle is expected to peak in July 2025.

Learn more about the Sun’s cycle and how it affects our solar system at nasa.gov/sunearth.

Make sure to follow us on Tumblr for your regular dose of space: http://nasa.tumblr.com.

NASA space science sun solar system sol solar cycle earth science sun science NOAA sun spots facts