Take a deep breath. Feel the oxygen in your lungs. We have the ocean to thank for that! Over long time scales, between 50 and 70 percent of our planet’s oxygen is produced by microscopic organisms living in the ocean.
Today is World Oceans Day! And as our planet’s climate continues to change, we want to understand how one of our biggest ecosystems is changing with it.
Wondering how you can celebrate with NASA? We’ve got downloadable coloring pages and online coloring interactives to show how we study the ocean. Read on.
We use planes, boats, Earth-observing satellites and much more to study the ocean and partner with organizations all over the world. Here are a few examples:
From Sea
The Export Processes in the Ocean from Remote Sensing (EXPORTS) is one way we study the ocean from the sea to study changes in the ocean’s carbon cycle. In May, scientists and crew conducted research on three ships in the Northern Atlantic Ocean. They hope to create models to better understand climate change patterns.
From Space
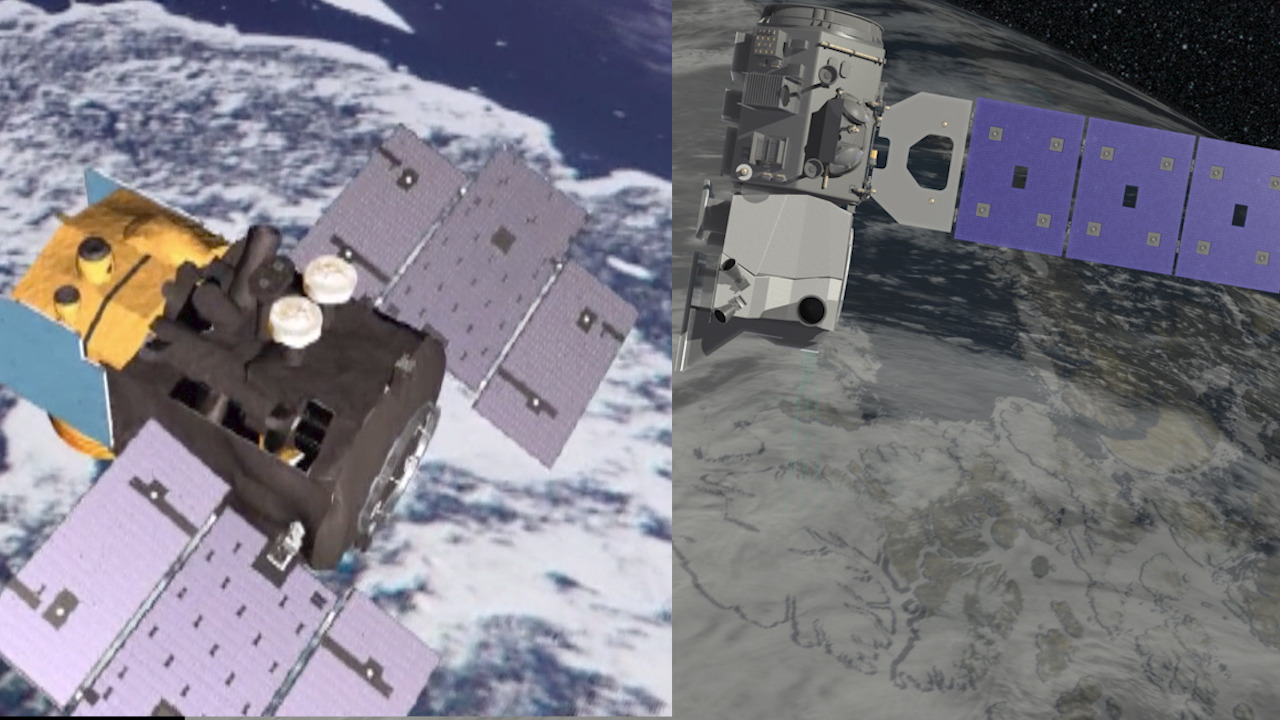
Launched last year, the Sentinel-6 Michael Freilich spacecraft began a five-and-a-half-year prime mission to collect the most accurate data yet on global sea level and how our oceans are rising in response to climate change. Sentinel-6 Michael Freilich is just one of many satellites monitoring the ocean from space. Together with other Earth-observing spacecraft, the mission will also collect precise data of atmospheric temperature and humidity to help improve weather forecasts and climate models.
Finding Eddies
Download Eddies Coloring Page The ocean is full of eddies – swirling water masses that look like hurricanes in the atmosphere. Eddies are often hot spots for biological activity that plays an important role in absorbing carbon. . We find eddies by looking for small changes in the height of the ocean surface, using multiple satellites continuously orbiting Earth. We also look at eddies up close, using ships and planes to study their role in the carbon cycle.
Tiny particles in the air called aerosols interact with clouds. These interactions are some of the most poorly understood components of Earth’s climate system. Clouds and aerosols can absorb, scatter or reflect incoming radiation – heat and light from the Sun – depending on their type, abundance and locations in the atmosphere. We’re building new instruments to better understand aerosols and contribute to air quality forecasts.
The Plankton, Aerosol, Cloud, ocean Ecosystem (PACE) mission will continue and greatly advance observations of global ocean color, biogeochemistry, and ecology, as well as Earth’s carbon cycle and atmospheric aerosols and clouds. It’s set to launch in late 2023 to early 2024. Want to learn more? Click here to see how PACE will collect data and here to see what PACE will see through our coloring interactives. (Make sure to check out the hidden surprises in both!)
Using our understanding of oceans on Earth, we also study oceans on other planets. Mars, for example, contains water frozen in the ice caps or trapped beneath the soil. But there’s even more water out there. Planets and moons in our solar system and beyond have giant oceans on their surface. Saturn’s moon Enceladus is thought to have a massive ocean under its frozen surface, which sometimes sprays into space through massive fissures in the ice.
In the vastness of the universe, the life-bringing beauty of our home planet shines bright. During this tumultuous year, our satellites captured some pockets of peace, while documenting data and striking visuals of unprecedented natural disasters. As 2020 comes to a close, we’re diving into some of the devastation, wonders, and anomalies this year had to offer.
NASA’s fleet of Earth-observing satellites and instruments on the International Space Station unravel the complexities of the blue marble from a cosmic vantage point. These robotic scientists orbit our globe constantly, monitoring and notating changes, providing crucial information to researchers here on the ground.
Take a glance at 2020 through the lens of NASA satellites:
Seen from space, the icy Ili River Delta contrasts sharply with the beige expansive deserts of southeastern Kazakhstan.
When the Operational Land Imager (OLI) on Landsat 8 acquired this natural-color image on March 7, 2020, the delta was just starting to shake off the chill of winter. While many of the delta’s lakes and ponds were still frozen, the ice on Lake Balkhash was breaking up, revealing swirls of sediment and the shallow, sandy bed of the western part of the lake.
The expansive delta and estuary is an oasis for life year round. Hundreds of plant and animal species call it home, including dozens that are threatened or endangered.
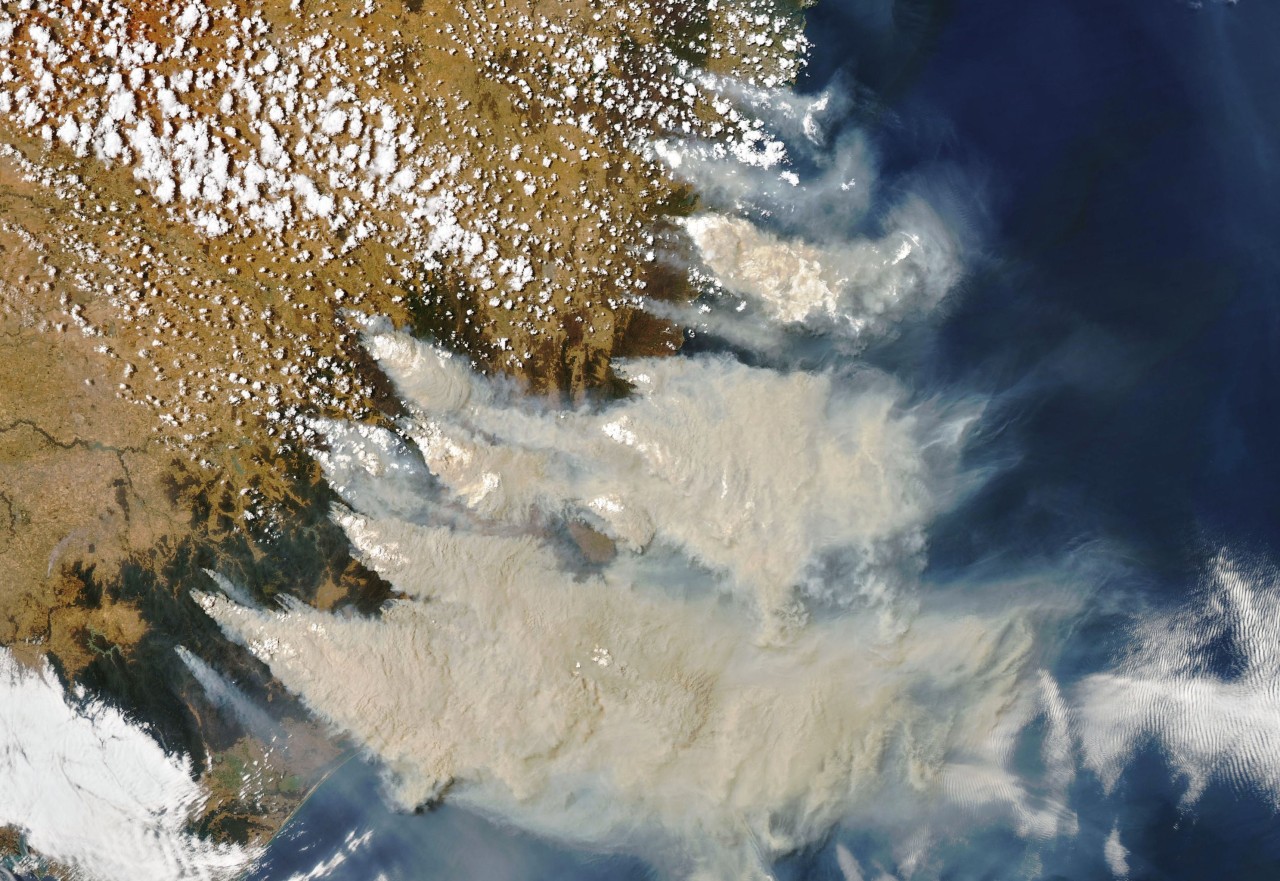
A record-setting and deadly fire season marred the beginning of the year in Australia. Residents of the southeastern part of the country told news media about daytime seeming to turn to night, as thick smoke filled the skies and intense fires drove people from their homes.
This natural-color image of Southeastern Australia was acquired on January 4, 2020, by the Moderate Resolution Imaging Spectroradiometer (MODIS) on NASA’s Aqua satellite. The smoke has a tan color, while clouds are bright white. It is likely that some of the white patches above the smoke are pyrocumulonimbus clouds—clouds created by the convection and heat rising from a fire.
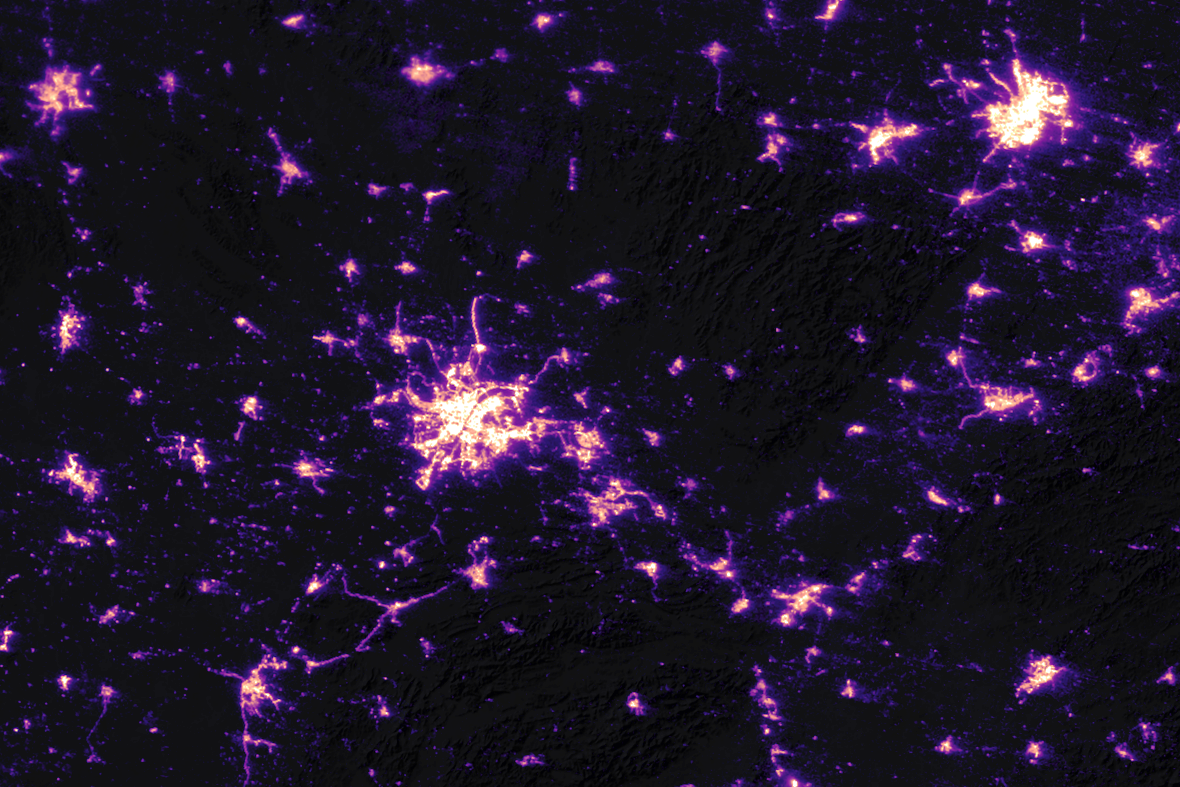
A team of scientists from NASA’s Goddard Space Flight Center (GSFC) and Universities Space Research Association (USRA) detected signs of the shutdown of business and transportation around Hubei province in central China. As reported by the U.S. State Department, Chinese authorities suspended air, road, and rail travel in the area and placed restrictions on other activities in late January 2020 in response to the COVID-19 outbreak in the region.
A research team analyzed images of Earth at night to decipher patterns of energy use, transportation, migration, and other economic and social activities. Data for the images were acquired with the Visible Infrared Imaging Radiometer Suite (VIIRS) on the NOAA–NASA Suomi NPP satellite (launched in 2011) and processed by GSFC and USRA scientists. VIIRS has a low-light sensor—the day/night band—that measures light emissions and reflections. This capability has made it possible to distinguish the intensity, types, and sources of lights and to observe how they change.
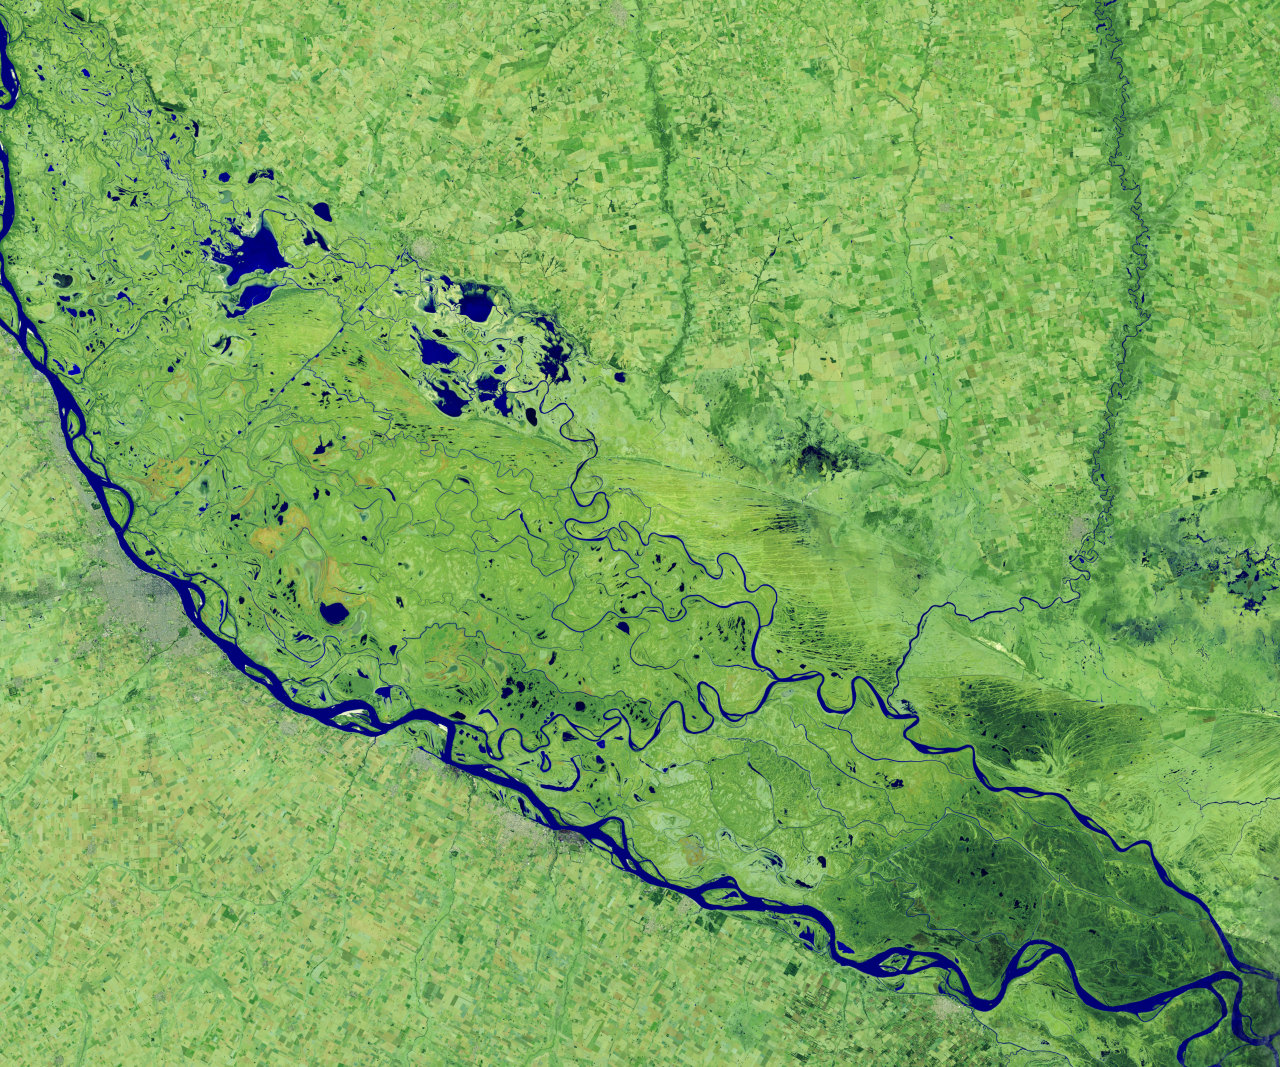
Though a seemingly serene oasis from above, there is more to this scene than meets the eye. On July 3, 2020, the Operational Land Imager (OLI) on Landsat 8 captured this false-color image of the river near Rosario, a key port city in Argentina. The combination of shortwave infrared and visible light makes it easier to distinguish between land and water. A prolonged period of unusually warm weather and drought in southern Brazil, Paraguay, and northern Argentina dropped the Paraná River to its lowest water levels in decades. The parched river basin has hampered shipping and contributed to an increase in fire activity in the delta and floodplain.
The drought has affected the region since early 2020, and low water levels have grounded several ships, and many vessels have had to reduce their cargo in order to navigate the river. With Rosario serving as the distribution hub for much of Argentina’s soy and other farm exports, low water levels have caused hundreds of millions of dollars in losses for the grain sector, according to news reports.
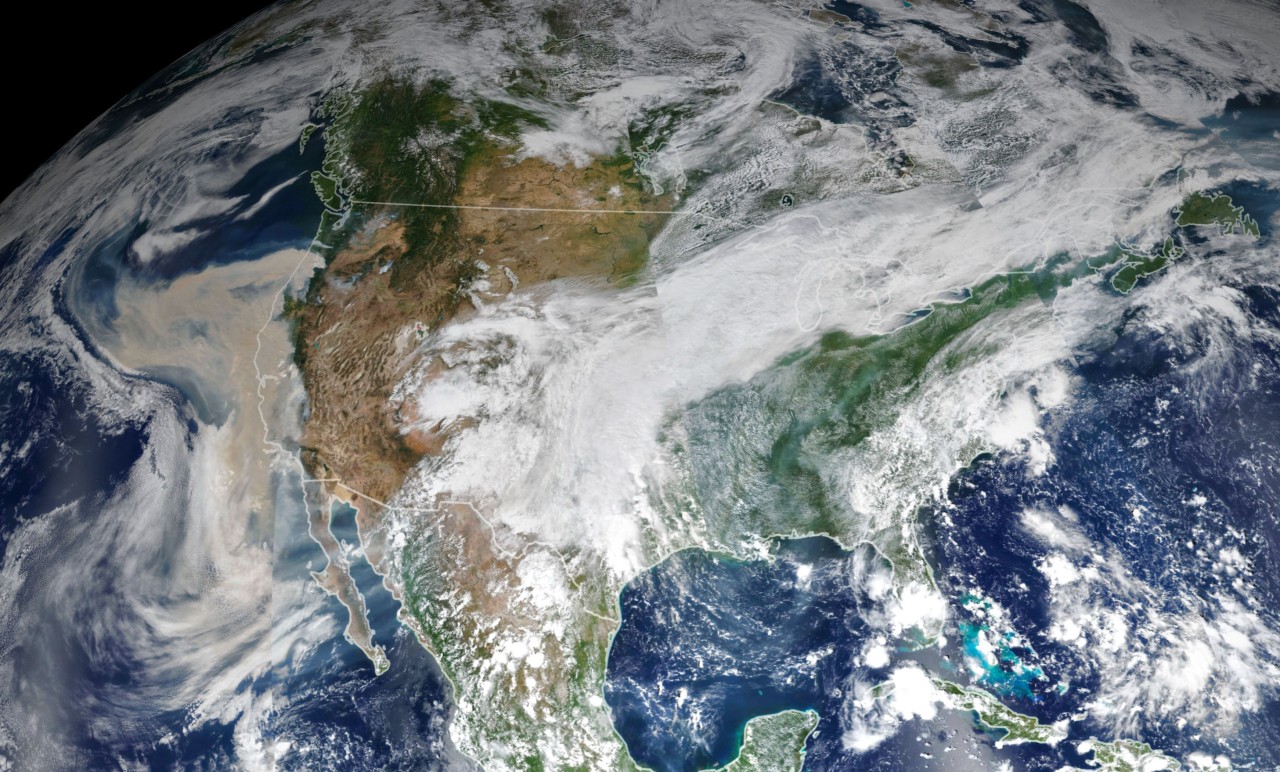
Climate and fire scientists have long anticipated that fires in the U.S. West would grow larger, more intense, and more dangerous. But even the most experienced among them have been at a loss for words in describing the scope and intensity of the fires burning in West Coast states during September 2020.
Lightning initially triggered many of the fires, but it was unusual and extreme meteorological conditions that turned some of them into the worst conflagrations in the region in decades.
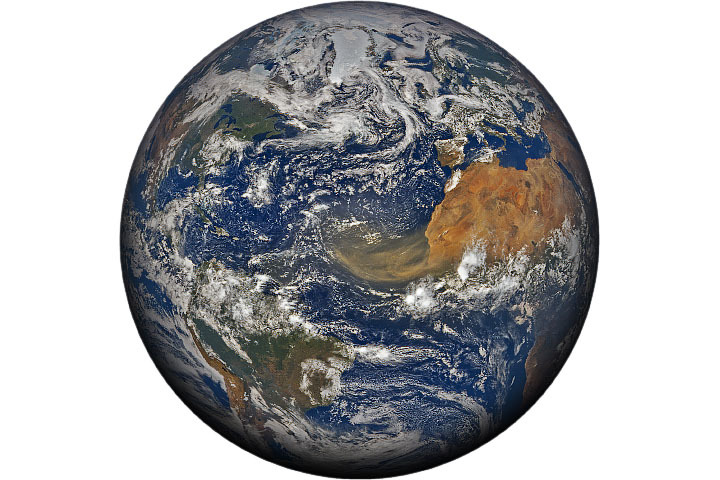
This image shows North America on September 9th, 2020, as a frontal boundary moved into the Great Basin and produced very high downslope winds along the mountains of Washington, Oregon, and California. The winds whipped up the fires, while a pyrocumulus cloud from the Bear fire in California injected smoke high into the atmosphere. The sum of these events was an extremely thick blanket of smoke along the West Coast.
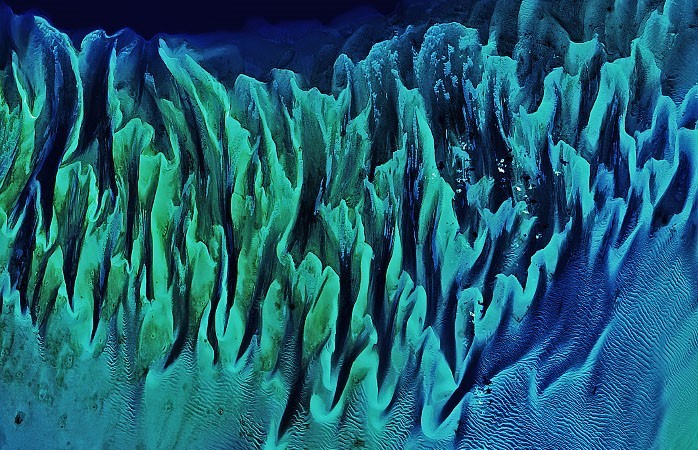
Though the bright blues of island waters are appreciated by many from a sea-level view, their true beauty is revealed when photographed from space. The underwater masterpiece photographed above is composed of sand dunes off the coast of the Bahamas.
The Great Bahama Bank was dry land during past ice ages, but it slowly submerged as sea levels rose. Today, the bank is covered by water, though it can be as shallow as two meters (seven feet) deep in places. The wave-shaped ripples in the image are sand on the seafloor. The curves follow the slopes of the dunes, which were likely shaped by a fairly strong current near the sea bottom. Sand and seagrass are present in different quantities and depths, giving the image it’s striking range of blues and greens.
This image was captured on February 15th, 2020, by Landsat 8, whose predecessor, Landsat 7, was the first land-use satellite to take images over coastal waters and the open ocean. Today, many satellites and research programs map and monitor coral reef systems, and marine scientists have a consistent way to observe where the reefs are and how they are faring.
Along with the plentiful harvest of crops in North America, one of the gifts of Autumn is the gorgeous palette of colors created by the chemical transition and fall of leaves from deciduous trees.
The folded mountains of central Pennsylvania were past peak leaf-peeping season but still colorful when the Operational Land Imager (OLI) on the Landsat 8 satellite passed over on November 9, 2020. The natural-color image above shows the hilly region around State College, Pennsylvania overlaid on a digital elevation model to highlight the topography of the area.
The region of rolling hills and valleys is part of a geologic formation known as the Valley and Ridge Province that stretches from New York to Alabama. These prominent folds of rock were mostly raised up during several plate tectonic collisions and mountain-building episodes in the Ordovician Period and later in the creation of Pangea—when what is now North America was connected with Africa in a supercontinent. Those events created the long chain of the Appalachians, one of the oldest mountain ranges in the world.
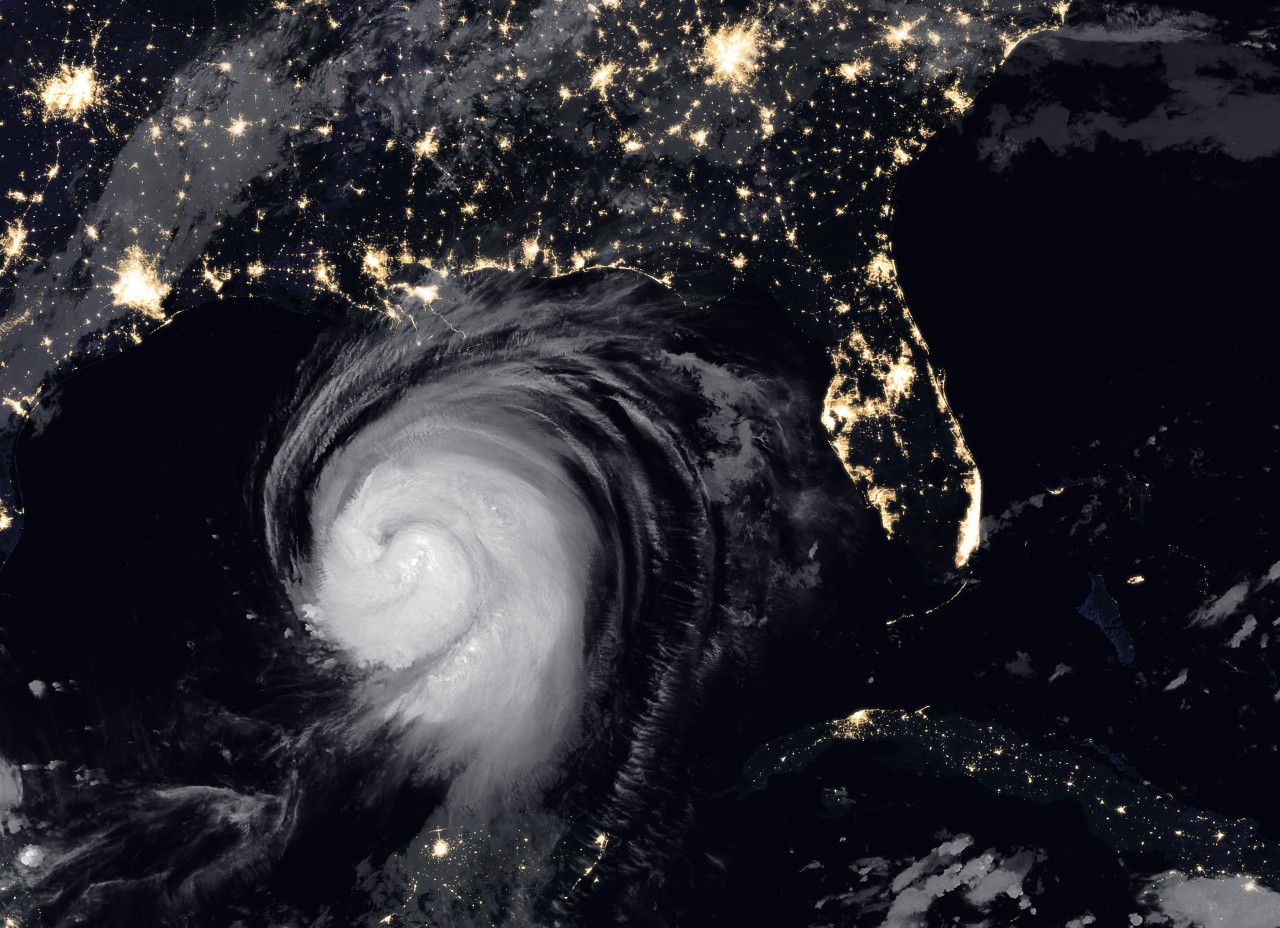
Ominous and looming, a powerful storm hovered off the US coastline illuminated against the dark night hues.
The Visible Infrared Imaging Radiometer Suite (VIIRS) on NOAA-20 acquired this image of Hurricane Laura at 2:20 a.m. Central Daylight Time on August 26, 2020. Clouds are shown in infrared using brightness temperature data, which is useful for distinguishing cooler cloud structures from the warmer surface below. That data is overlaid on composite imagery of city lights from NASA’s Black Marble dataset.
Hurricane Laura was among the ten strongest hurricanes to ever make landfall in the United States. Forecasters had warned of a potentially devastating storm surge up to 20 feet along the coast, and the channel might have funneled that water far inland. It did not. The outcome was also a testament to strong forecasting and communication by the National Hurricane Center and local emergency management authorities in preparing the public for the hazards.
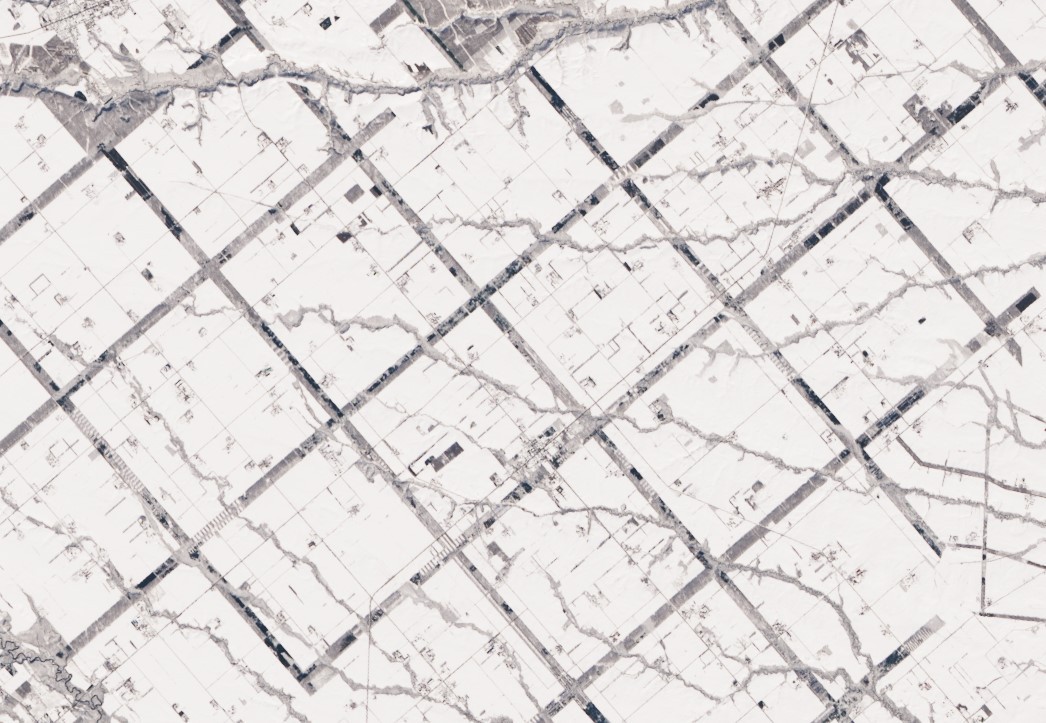
From above, the Konsen Plateau in eastern Hokkaido offers a remarkable sight: a massive grid that spreads across the rural landscape like a checkerboard, visible even under a blanket of snow. Photographed by the Operational Land Imager (OLI) on Landsat 8, this man-made design is not only aesthetically pleasing, it’s also an agricultural insulator.
The strips are forested windbreaks—180-meter (590-foot) wide rows of coniferous trees that help shelter grasslands and animals from Hokkaido’s sometimes harsh weather. In addition to blocking winds and blowing snow during frigid, foggy winters, they help prevent winds from scattering soil and manure during the warmer months in this major dairy farming region of Japan.
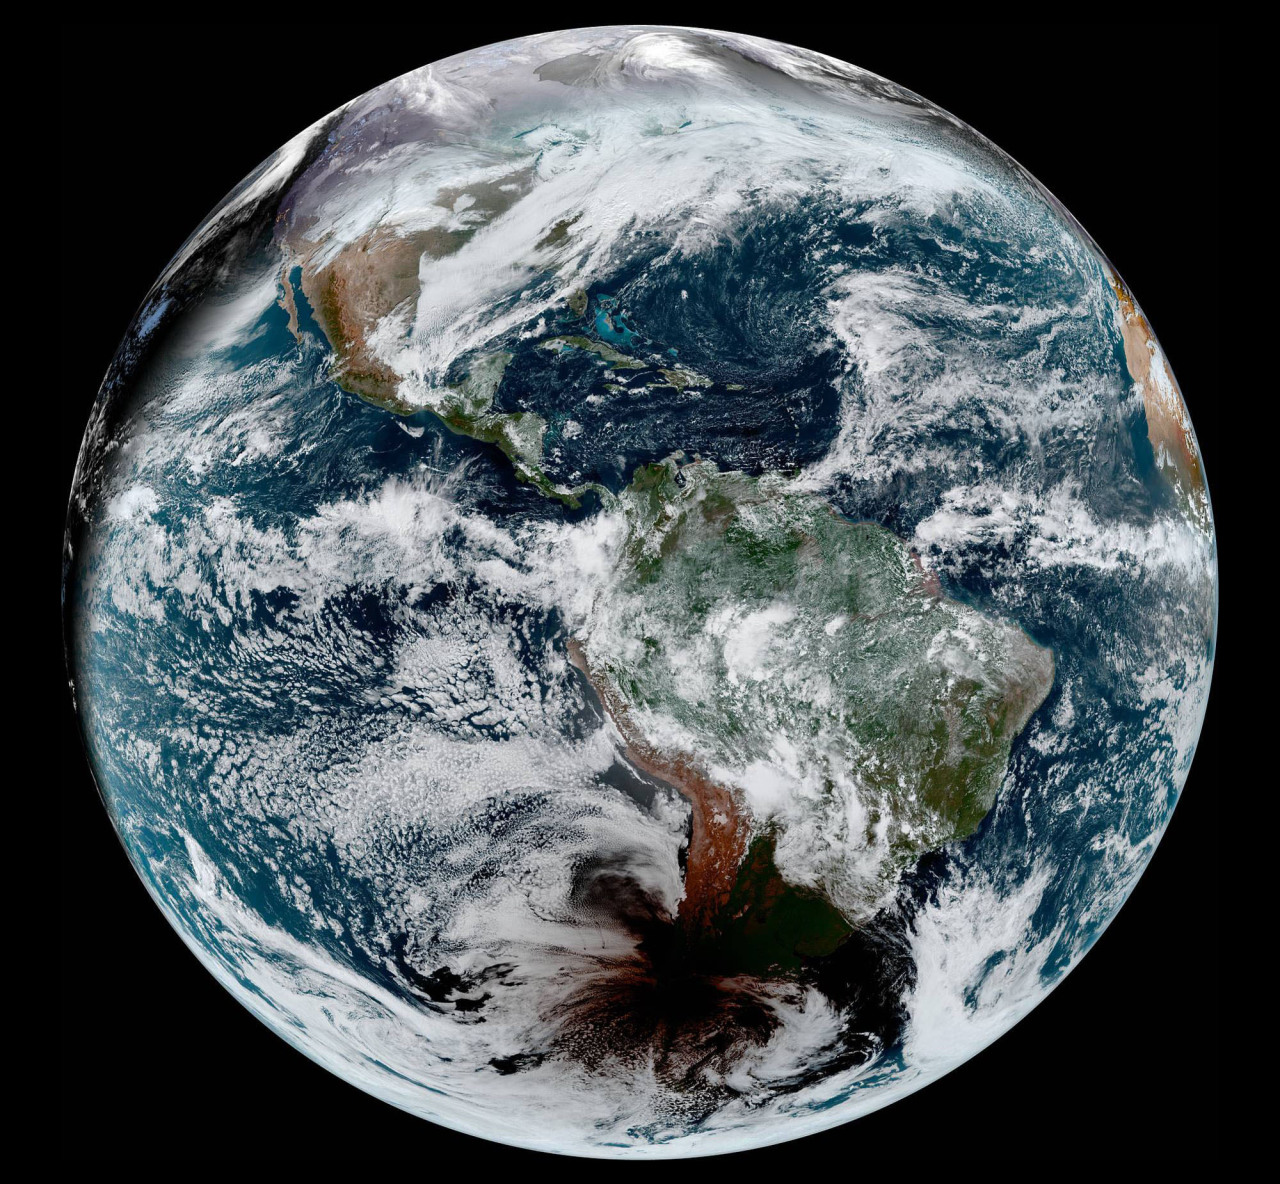
Formidable, rare, and awe-inspiring — the first and only total solar eclipse of 2020 occurred on December 14, with the path of totality stretching from the equatorial Pacific to the South Atlantic and passing through southern Argentina and Chile as shown in the lower half of the image above. The Advanced Baseline Imager (ABI) on Geostationary Operational Environmental Satellite 16 (GOES-16) captured these images of the Moon’s shadow crossing the face of Earth.
The “path of totality” (umbral path) for the eclipse was roughly 90 kilometers (60 miles) wide and passed across South America from Saavedra, Chile, to Salina del Eje, Argentina. While a total eclipse of the Sun occurs roughly every 18 months, seeing one from any particular location on Earth is rare. On average, a solar eclipse passes over the same parcel of land roughly every 375 years. The next total solar eclipse will occur on December 4, 2021 over Antarctica, and its next appearance over North America is projected for April 8, 2024.
Earth is a big weird planet. With so much going on, it’s easy to forget some of the many, many processes happening here. But at the same time, some stuff is so unexpected and just plain strange that it’s impossible to forget. We asked around and found out lots of people here at NASA have this problem.
Here are some facts about Earth that live rent free in our heads:
Earth has a solid inner core that is almost as hot as the surface of the Sun. Earth’s core gets as high as 9,800 degrees Fahrenheit, while the surface of the Sun is about 10,000 degrees Fahrenheit.
Dust from the Sahara fertilizes the Amazon rainforest. 27.7 million tons blow all the way across the Atlantic Ocean to the rainforest each year, where it brings phosphorus – a nutrient plants need to grow.
Ice in Antarctica looks solid and still, but it’s actually flowing – in some places it flows so fast that scientific instruments can move as much as a kilometer (more than half a mile!) a year.
Speaking of Antarctica: Ice shelves (the floating part of ice sheets) can be as big as Texas. Because they float, they rise and fall with the tide. So floating ice as big as Texas, attached to the Antarctic Ice Sheet, can rise and fall up to ~26 feet!
Melting ice on land makes its way to the ocean. As polar glaciers melt, the water sloshes to the equator, and which can actually slow the spin of Earth.
Even though it looks it, the ocean isn’t level. The surface has peaks and valleys and varies due to changes in height of the land below, winds, temperature, saltiness, atmospheric pressure, ocean circulation, and more.
Earth isn’t the only mind-blowing place out there. From here, we look out into the rest of the universe, full of weird planets and galaxies that surprise us.
“At a glacial pace” used to mean moving so slowly the movement is almost imperceptible. Lately though, glaciers are moving faster. Ice on land is melting and flowing, sending water to the oceans, where it raises sea levels.
In 2018, we launched the Ice, Cloud and Land Elevation Satellite-2 (ICESat-2) to continue a global record of ice elevation. Now, the results are in. Using millions of measurements from a laser in space and quite a bit of math, researchers have confirmed that Earth is rapidly losing ice.
16 Years
ICESat-2 was a follow-up mission to the original ICESat, which launched in 2003 and took measurements until 2009. Comparing the two records tells us how much ice sheets have lost over 16 years.
½ Inch
During those 16 years, melting ice from Antarctica and Greenland was responsible for just over a half-inch of sea level rise. When ice on land melts, it eventually finds its way to the ocean. The rapid melt at the poles is no exception.
400,000 Olympic Swimming Pools
One gigaton of ice holds enough water to fill 400,000 Olympic swimming pools. It’s also enough ice to cover Central Park in New York in more than 1,000 feet of ice.
200 Gigatons
Between 2003 and 2019, Greenland lost 200 gigatons of ice per year. That’s 80 million Olympic swimming pools reaching the ocean every year, just from Greenland alone.
118 Gigatons
During the same time period, Antarctica lost 118 gigatons of ice per year. That’s another 47 million Olympic swimming pools every year. While there has been some elevation gain in the continent’s center from increased snowfall, it’s nowhere near enough to make up for how much ice is lost to the sea from coastal glaciers.
10,000 Pulses
ICESat-2 sends out 10,000 pulses of laser light a second down to Earth’s surface and times how long it takes them to return to the satellite, down to a billionth of a second. That’s how we get such precise measurements of height and changing elevation.
These numbers confirm what scientists have been finding in most previous studies and continue a long record of data showing how Earth’s polar ice is melting. ICESat-2 is a key tool in our toolbox to track how our planet is changing.