Built on top of Plotly.js, React and Flask, Dash ties modern UI elements like dropdowns, sliders, and graphs directly to your analytical Python code. Read our tutorial proudly crafted ❤️ by Dash itself.
-
Dash Docs on Heroku (for corporate network that cannot access plot.ly)
| App | Description |
|---|---|
 |
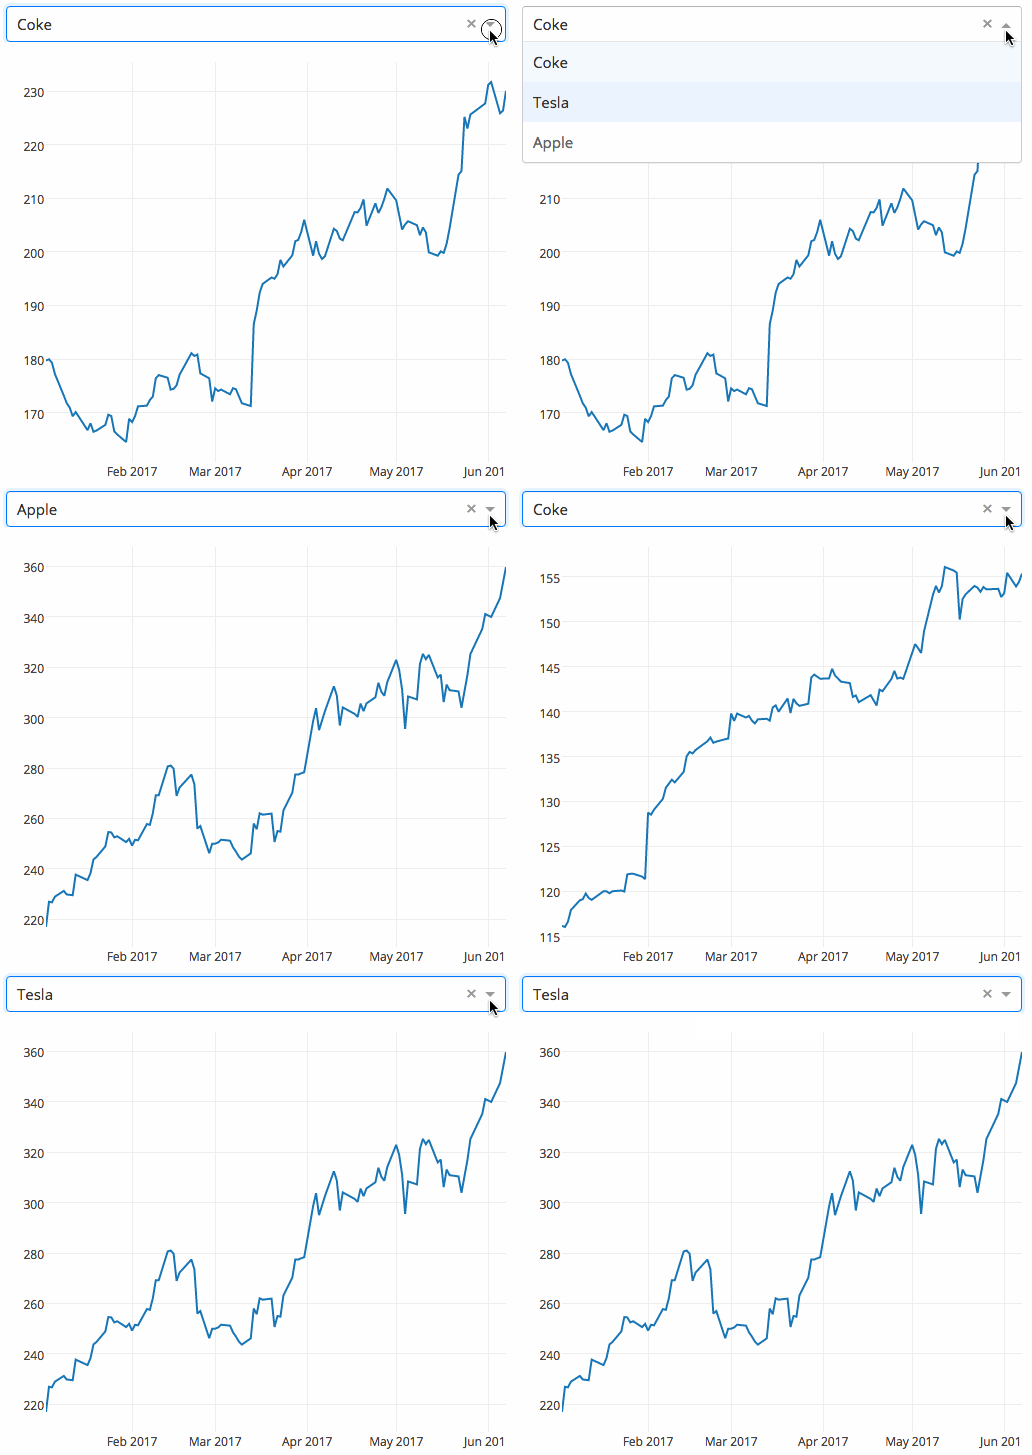
Here’s a simple example of a Dash App that ties a Dropdown to a D3.js Plotly Graph. As the user selects a value in the Dropdown, the application code dynamically exports data from Google Finance into a Pandas DataFrame. This app was written in just 43 lines of code (view the source). |
 |
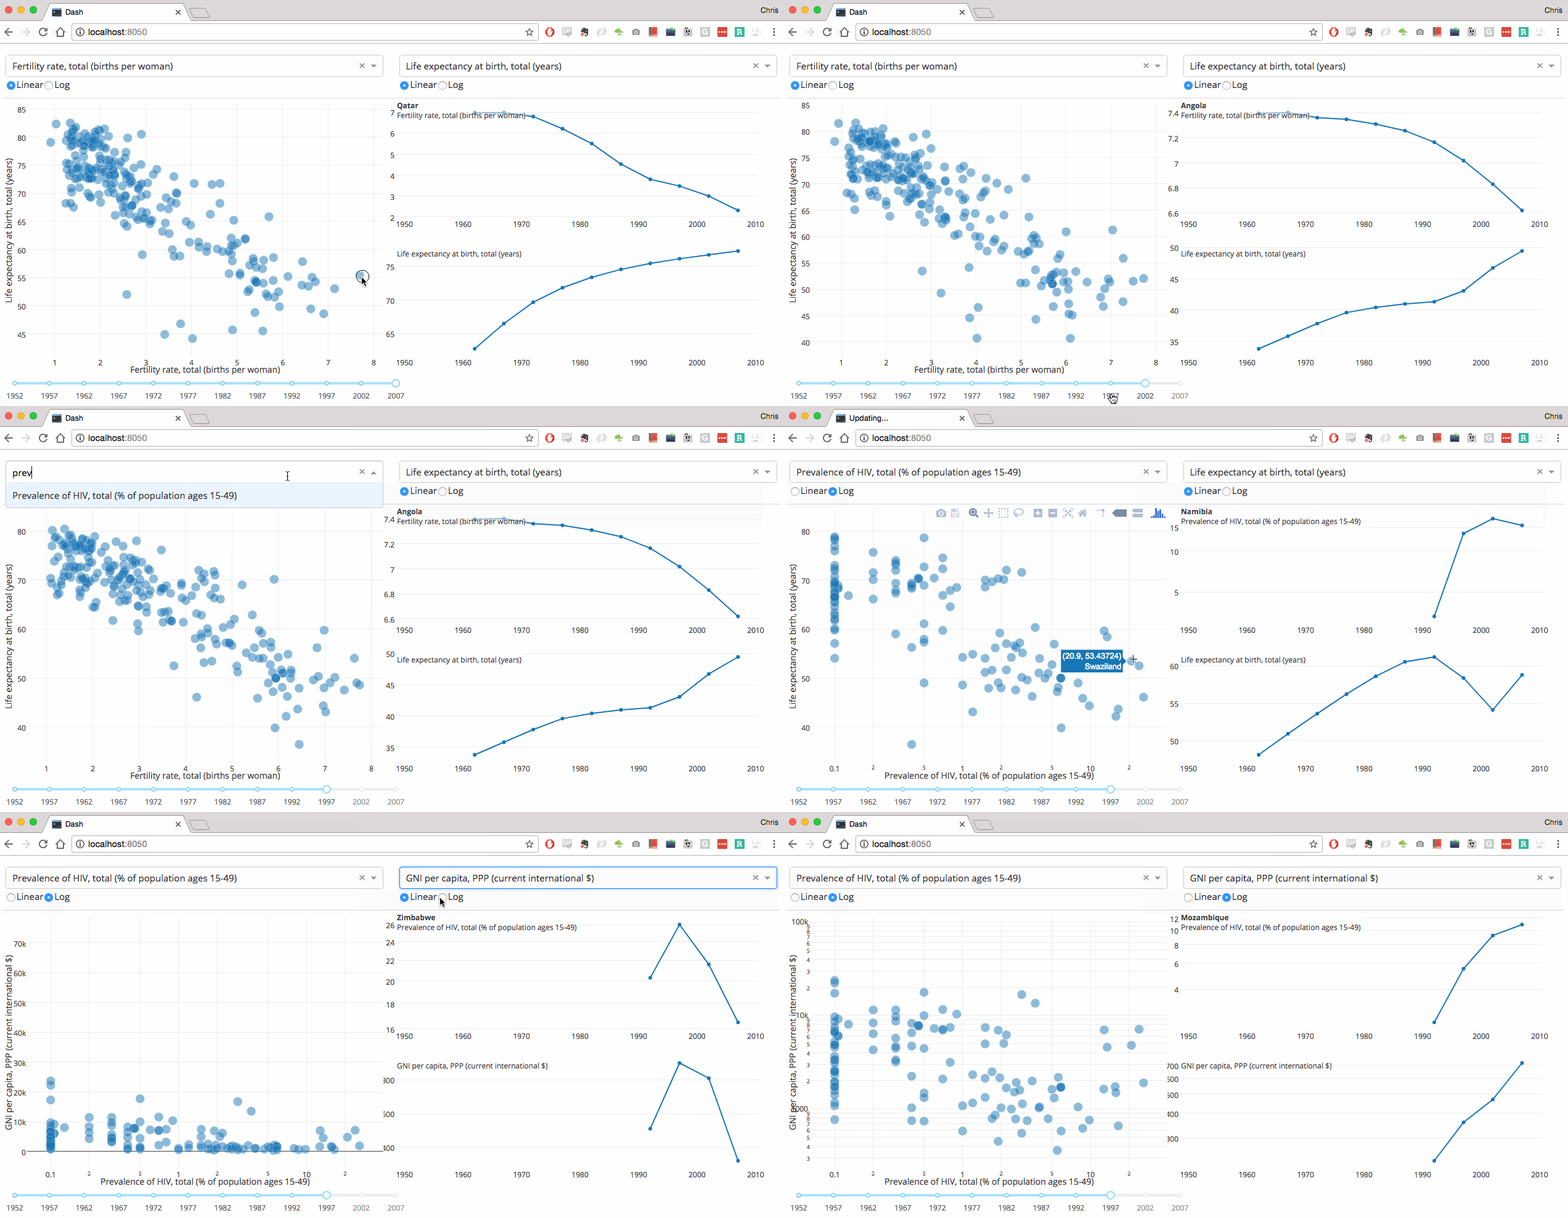
Dash app code is declarative and reactive, which makes it easy to build complex apps that contain many interactive elements. Here’s an example with 5 inputs, 3 outputs, and cross filtering. This app was composed in just 160 lines of code, all of which were Python. |
 |
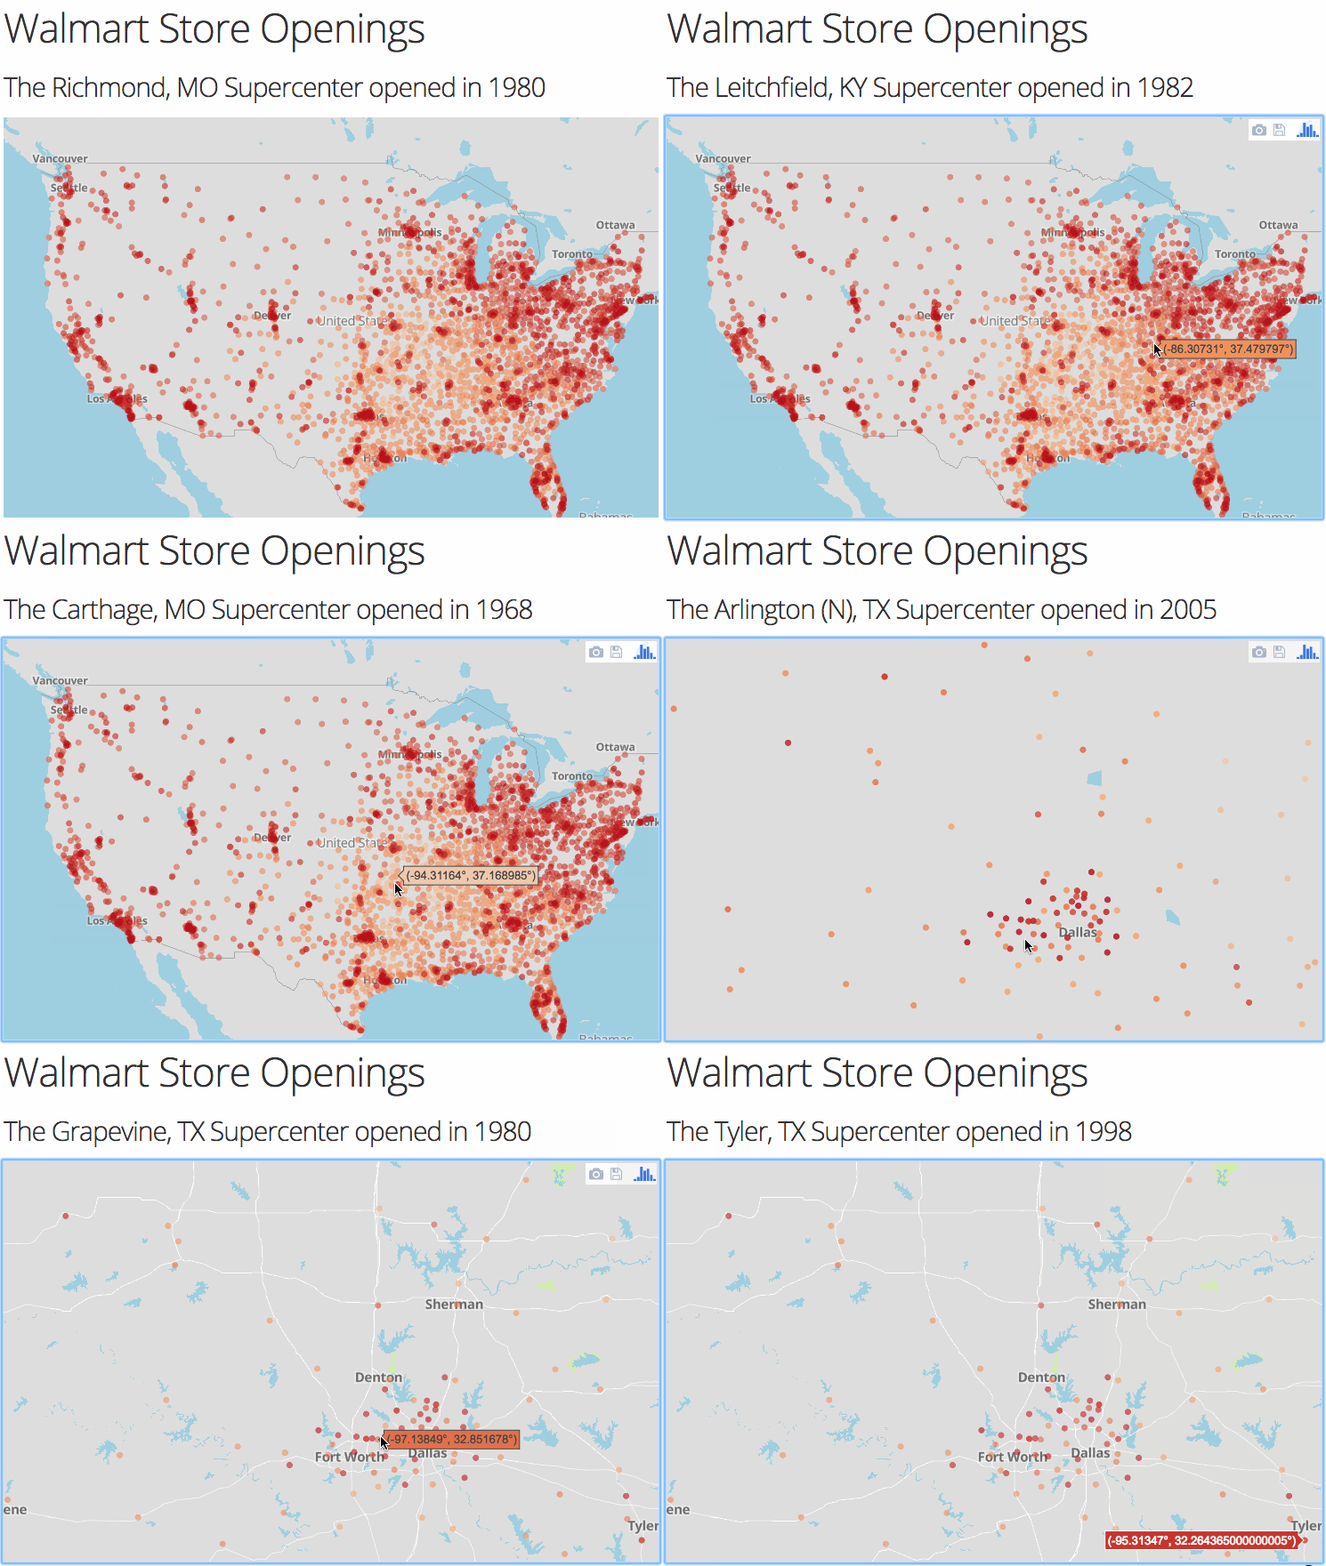
Dash uses Plotly.js for charting. Over 35 chart types are supported, including maps. |
 |
Dash isn't just for dashboards. You have full control over the look and feel of your applications. Here's a Dash App that's styled to look like a PDF report. |
To learn more about Dash, read the extensive announcement letter or jump in with the user guide.
For companies with software budgets, Plotly offers
- Dash Deployment Server speeds your time-to-delivery while providing the right resources, security, and scalability you need to deliver production-quality apps
- Dash Design Kit makes your internal dashboard awesome without expertise in JavaScript & CSS.
- Snapshot Engine seamlessly links your analytics and reporting workflows together, giving you a fast way to generate interactive reports of just the data you need
See https://plot.ly/dash/support for ways to get in touch.
