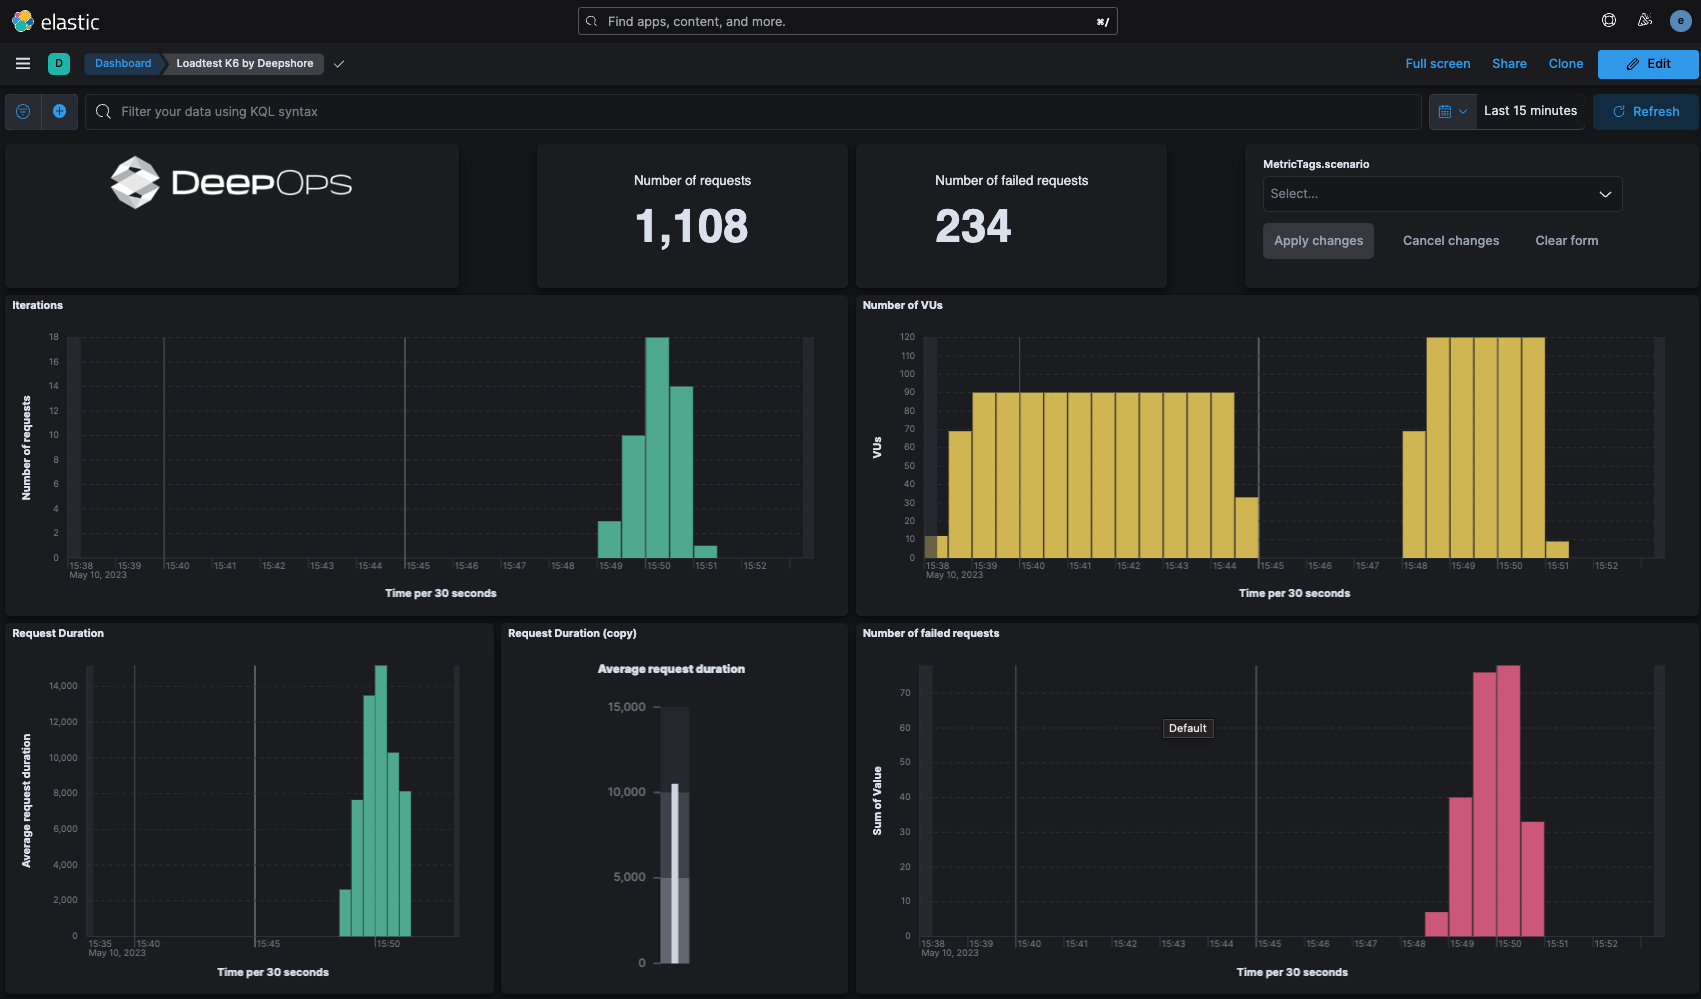
A condensed demo setup of everything you need to get k6 running seriously on k8s
- github account
- PAT with repo:read scope
- a running kubernetes system and the usual suspects of tools. our recommendation: rancher-desktop
- k6 installed
- k6-operator installed
- minimal javascript knowledge
- minimal knowledge about handling dashboard and visualizations in kibana
- clone this repo and open a terminal with prerequisites installed.
- install elasticsearch crds and operator via
kubectl create -f https://download.elastic.co/downloads/eck/2.6.1/crds.yamlandkubectl apply -f https://download.elastic.co/downloads/eck/2.6.1/operator.yaml
- OPTIONAL: install grafana operator via
kubectl create -k grafana-operator/overlays/cluster_scoped
- create a namespace
kubectl create ns k6demo - switch context
kubectl config set-context --current --namespace k6demo - issue a [token with scope repo:read] (https://github.com/settings/tokens/new?scopes=read:packages)
- export the token in your shell
export CR_PAT=YOUR_TOKEN - create a secret to allow k8s to pull from our repository by
kubectl create secret docker-registry github-registry \
--docker-server=https://ghcr.io \
--docker-username=unset \
--docker-password=$CR_PAT \
[email protected] \
-n k6demo
-
setup an elastic node
kubectl apply -f resources/k6_elasticsearch.yaml -
check elasticsearch with
kubectl wait --for=jsonpath='{.status.phase}'=Ready elasticsearch metrics-db -
setup a kibana node
kubectl apply -f resources/k6_kibana.yaml -
check kibana with
kubectl wait --for=jsonpath='{.status.health}'=green kibana metrics-ui -
port forward
kubectl port-forward service/metrics-ui-kb-http 5601 -
open kibana in browser and login with
elasticand the password you obtain with this commandkubectl get secret metrics-db-es-elastic-user -o=jsonpath='{.data.elastic}' | base64 --decode; echo -
import the saved objects located in kibana folder via Kibana Stack Management
-
Check Kibana Dashboards
-
done. you have a complete k8s based k6 testing environment.
-
OPTIONAL: you can additionally spin up a grafana node now
- replace the "secret" word in grafana/k6_grafana_datasource.yaml with the password for elastic user
kubectl apply -f grafana
kubectl apply -f resourceskubectl wait --for=jsonpath='{.status.stage}'=finished k6 k6-test-by-deepshore- now check that dashboard again
