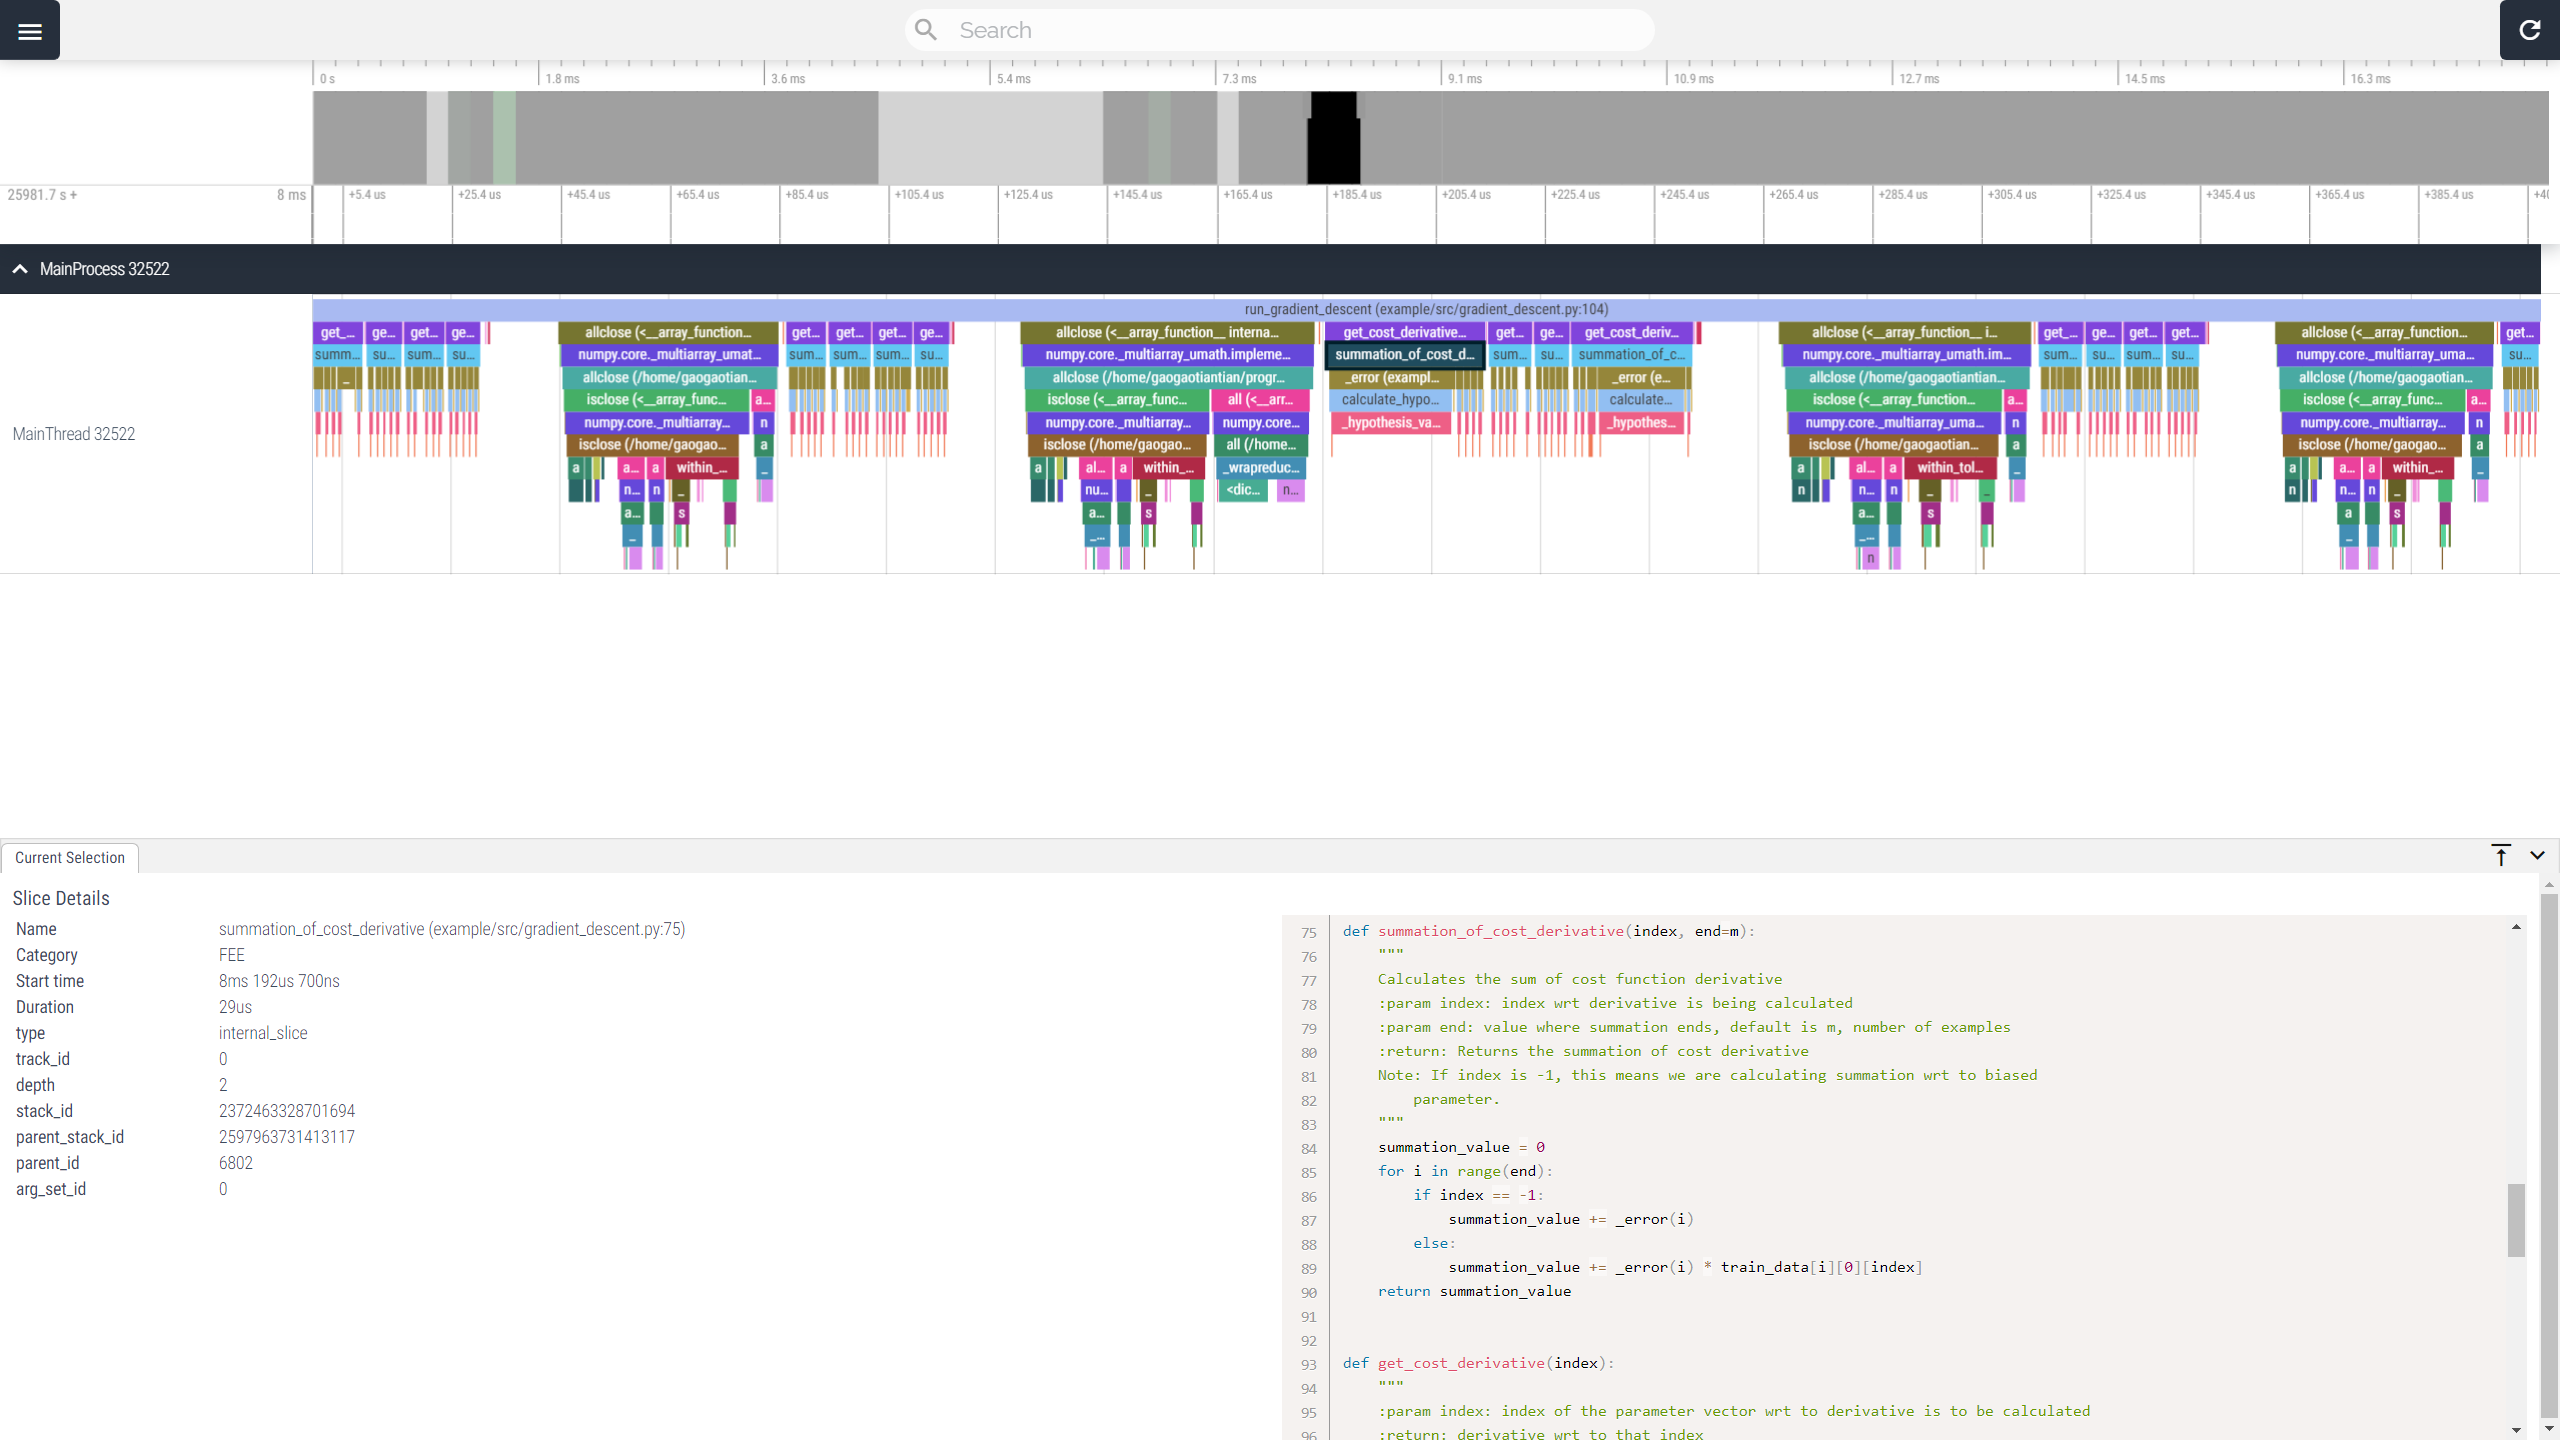
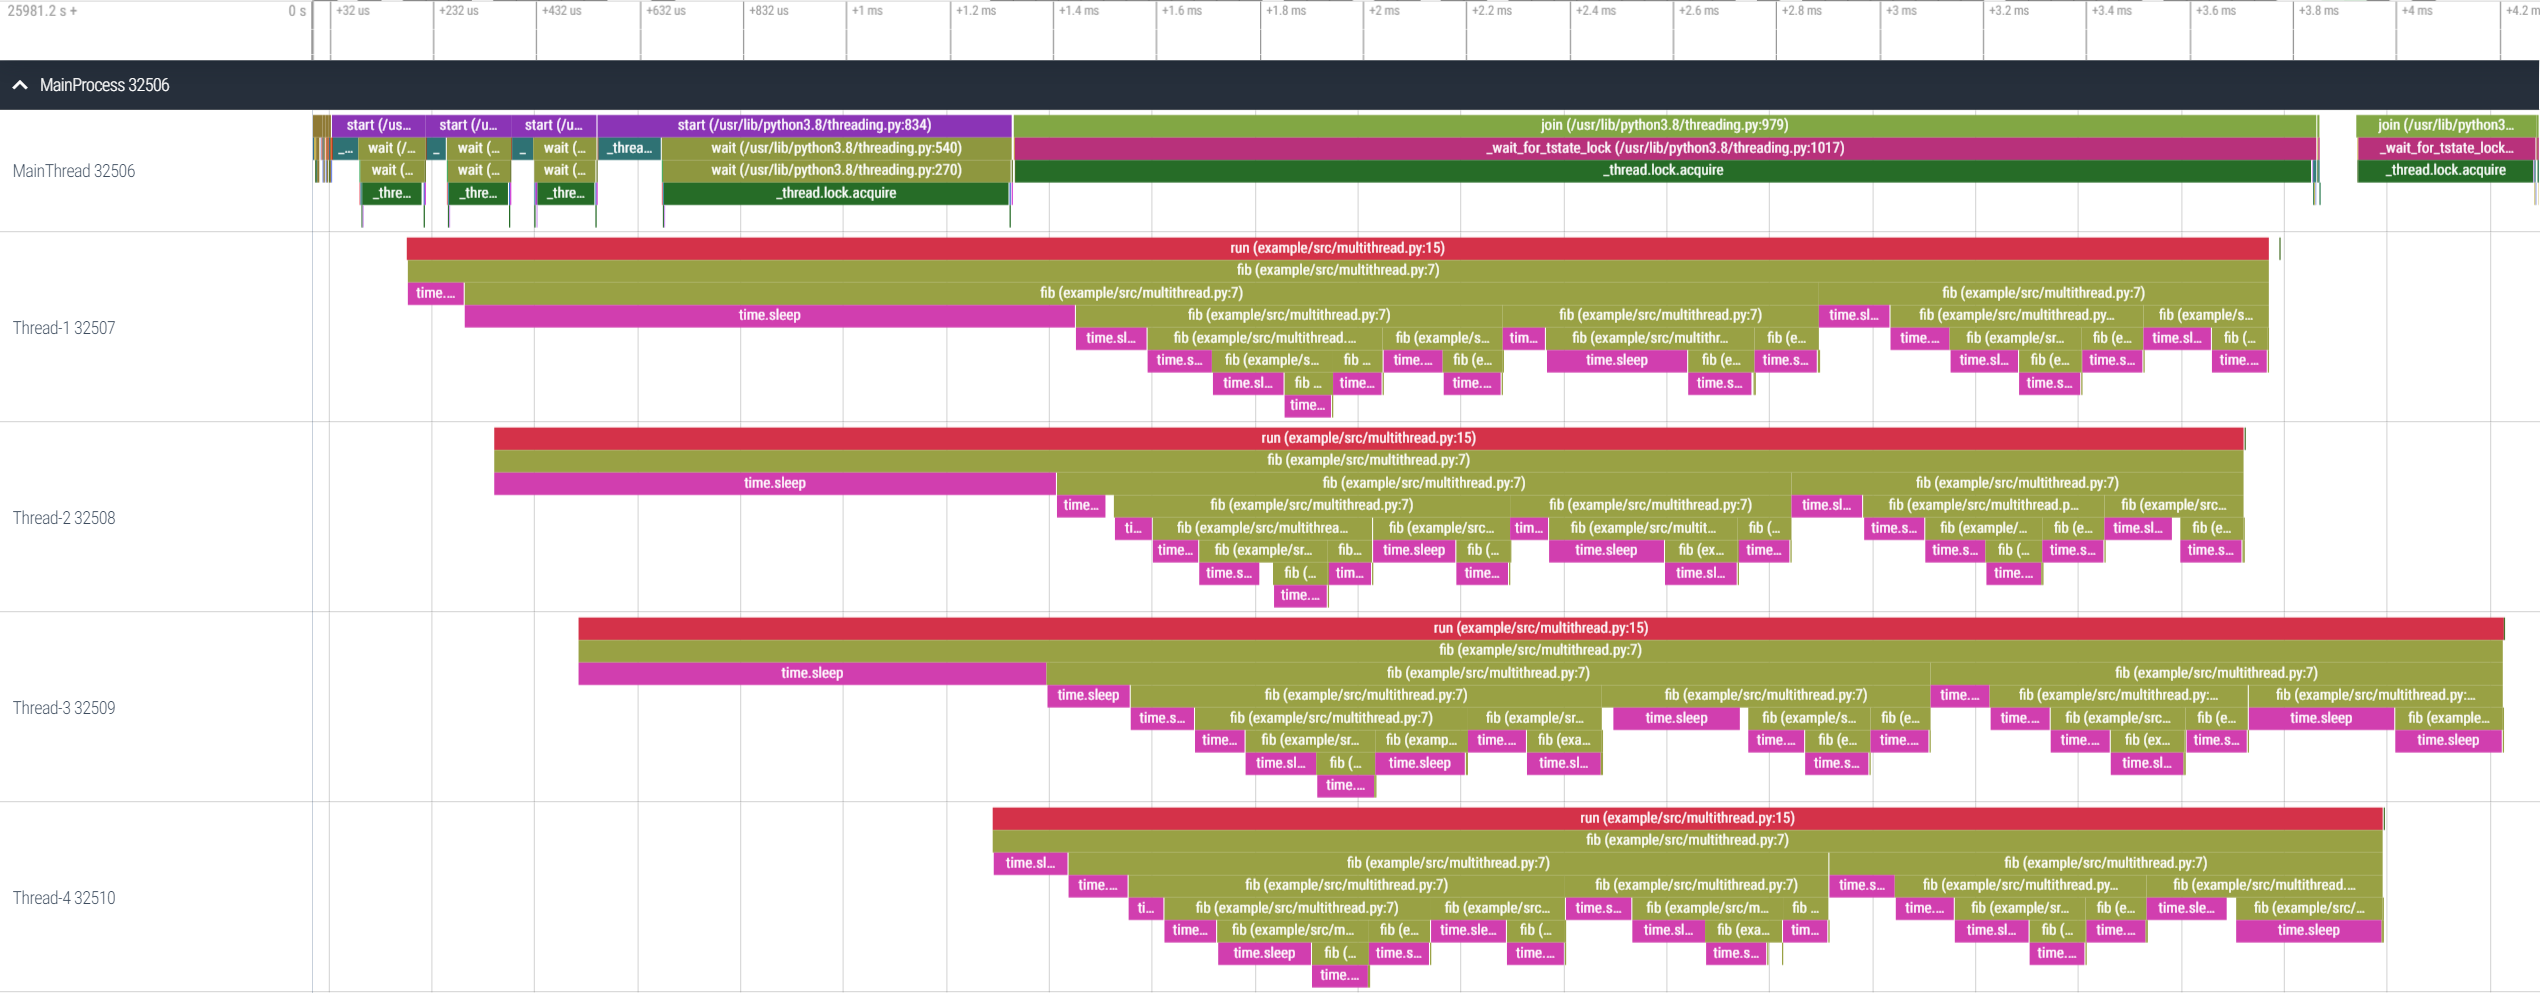
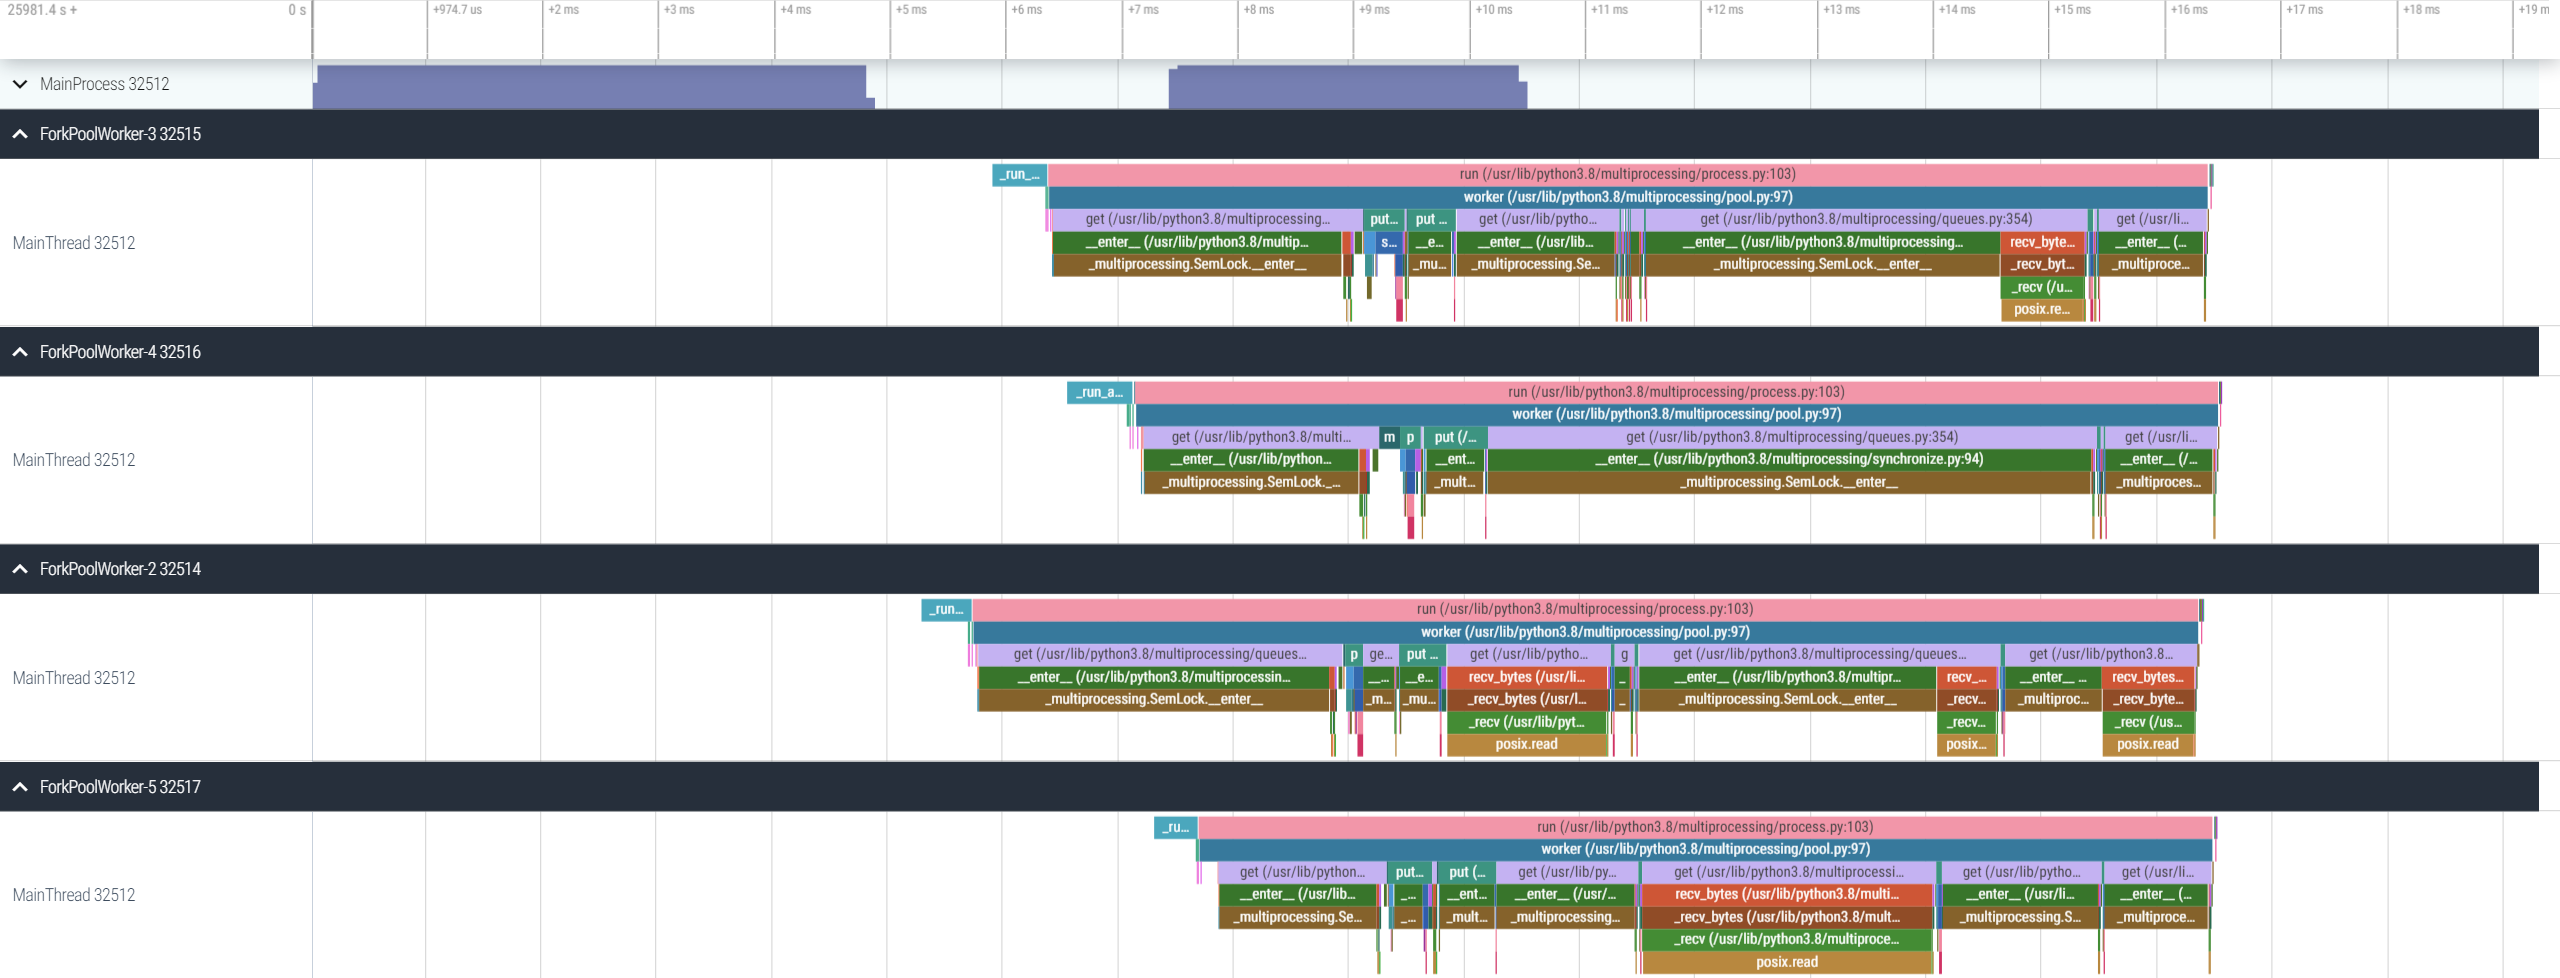
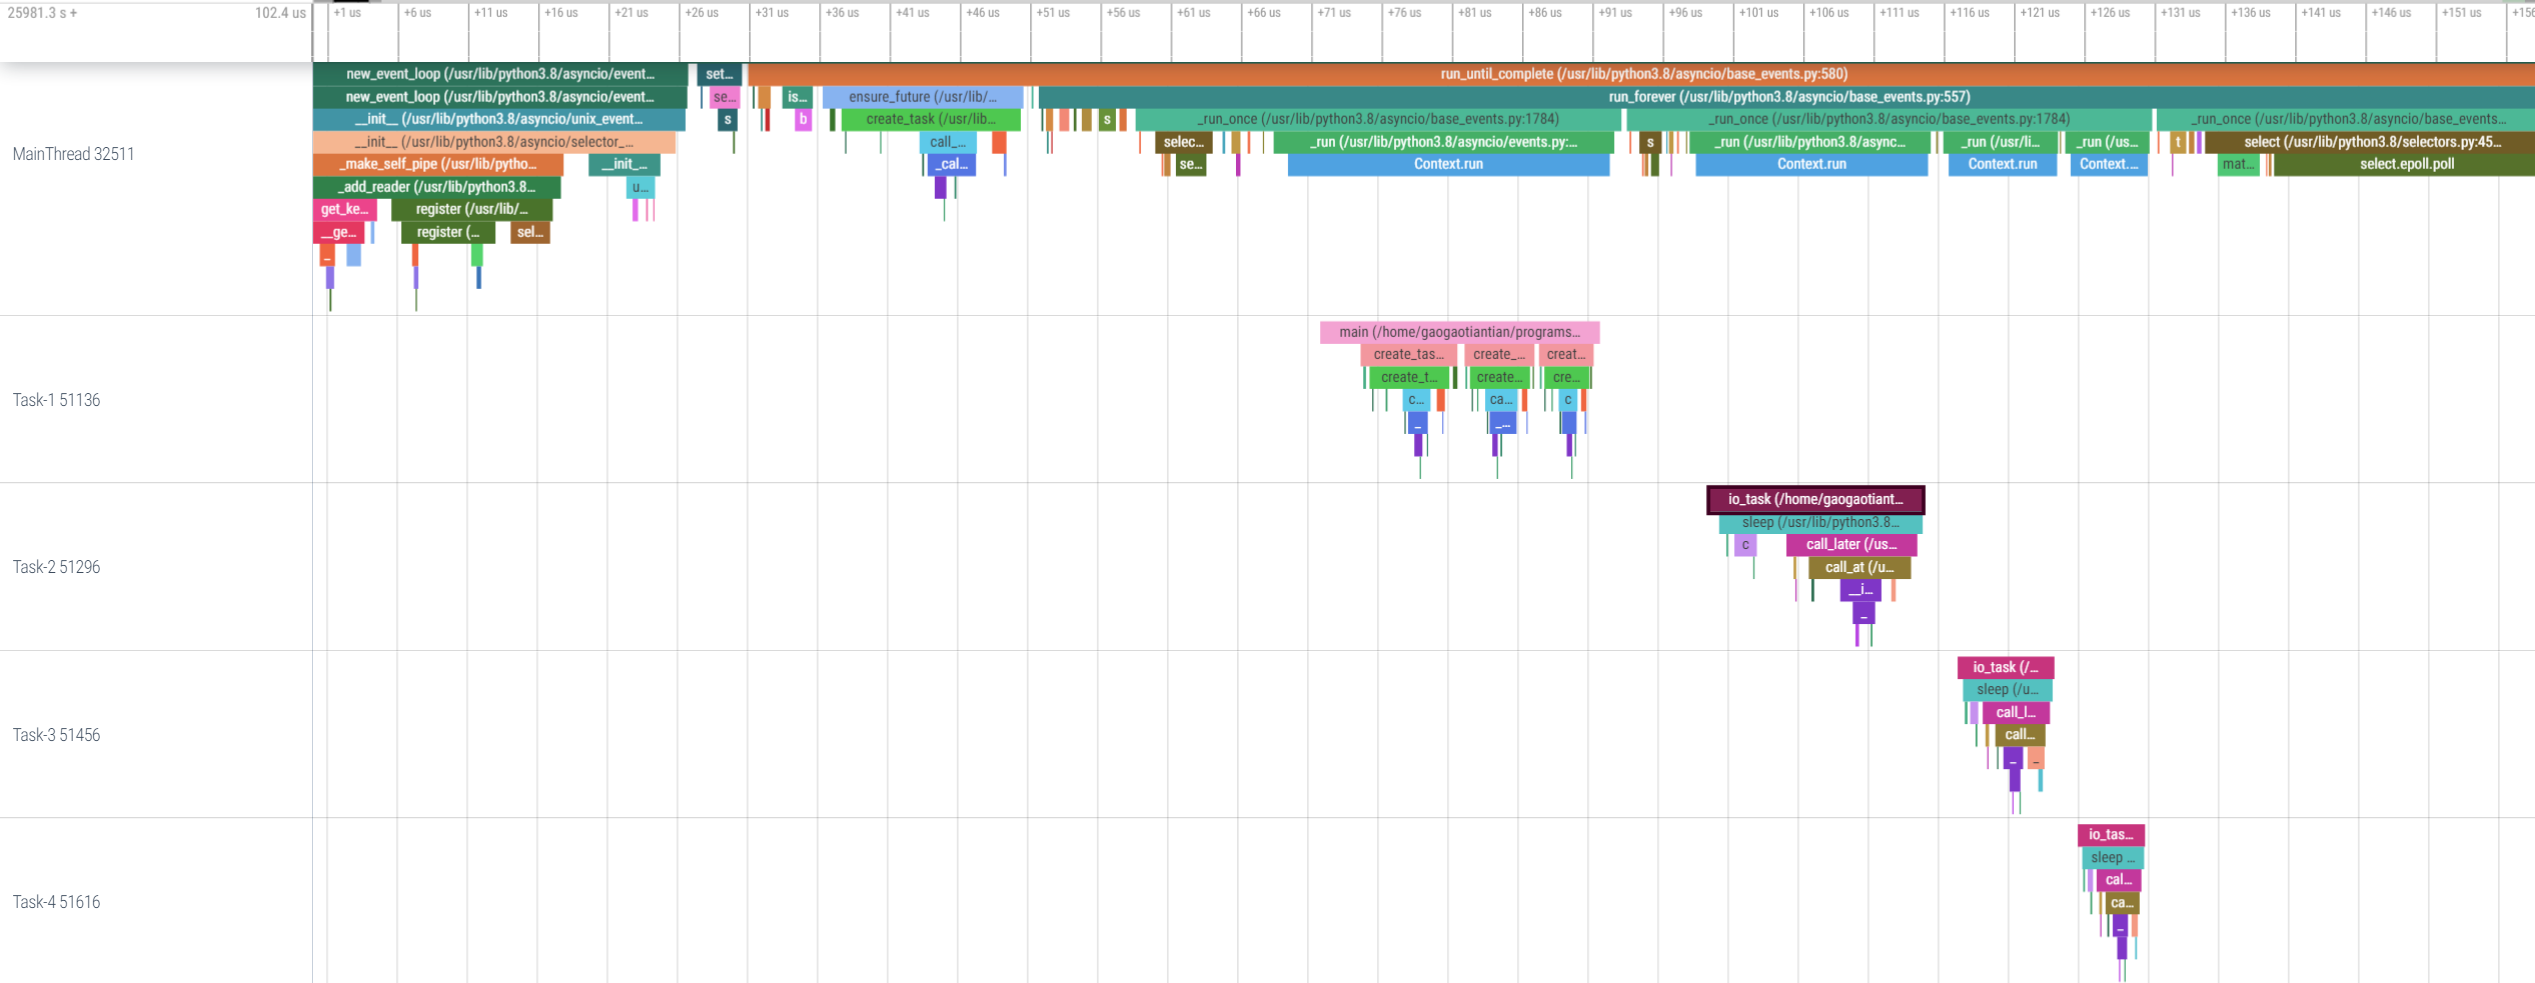
VizTracer is a low-overhead logging/debugging/profiling tool that can trace and visualize your python code execution.
The front-end UI is powered by Perfetto. Use "AWSD" to zoom/navigate. More help can be found in "Support - Controls".
- Detailed function entry/exit information on timeline with source code
- Super easy to use, no source code change for most features, no package dependency
- Low overhead, probably the fastest tracer in the market
- Supports threading, multiprocessing, subprocess, async and PyTorch
- Powerful front-end, able to render GB-level trace smoothly
- Works on Linux/MacOS/Windows
The preferred way to install VizTracer is via pip
pip install viztracer# Instead of "python3 my_script.py arg1 arg2"
viztracer my_script.py arg1 arg2
A result.json file will be generated, which you can open with vizviewer
# You can display all the files in a directory and open them in browser too
vizviewer ./
# For very large trace files, try external trace processor
vizviewer --use_external_processor result.json
vizviewer will host an HTTP server on http://localhost:9001. You can also open your browser and use that address.
If you do not want vizviewer to open the webbrowser automatically, you can use
vizviewer --server_only result.jsonIf you just need to bring up the trace report once, and do not want the persistent server, use
vizviewer --once result.jsonvizviewer result.jsonA VS Code Extension is available to make your life even easier.
Add --open to open the reports right after tracing
viztracer --open my_script.py arg1 arg2
viztracer -o result.html --open my_script.py arg1 arg2
modules and console scripts(like flask) are supported as well
viztracer -m your_moduleviztracer flask runYou can also manually start/stop VizTracer in your script as well.
from viztracer import VizTracer

tracer = VizTracer()
tracer.start()
# Something happens here
tracer.stop()
tracer.save() # also takes output_file as an optional argument
Or, you can do it with with statement
with VizTracer(output_file="optional.json") as tracer:
# Something happens hereIf you are using Jupyter, you can use viztracer cell magics.
# You need to load the extension first
%load_ext viztracer%%viztracer
# Your code afterA VizTracer Report button will appear after the cell and you can click it to view the results
VizTracer can log native calls and GPU events of PyTorch (based on torch.profiler) with
--log_torch.
with VizTracer(log_torch=True) as tracer:
    # Your torch code
viztracer --log_torch your_model.pyVizTracer can filter out the data you don't want to reduce overhead and keep info of a longer time period before you dump the log.
VizTracer can log extra information without changing your source code
- Any Variable/Attribute with RegEx
- Function Entry
- Variables in Specified Function
- Garbage Collector Operation
- Function Input Arguments
- Function Return Value
- Audit Events
- Raised Exceptions
VizTracer supports inserting custom events while the program is running. This works like a print debug, but you can know when this print happens while looking at trace data.
For Python3.12+, VizTracer supports Python-level multi-thread tracing without the need to do any modification to your code.
For versions before 3.12, VizTracer supports python native threading module. Just start VizTracer before you create threads and it will just work.
For other multi-thread scenarios, you can use enable_thread_tracing() to notice VizTracer about the thread to trace it.
Refer to multi thread docs for details
VizTracer supports subprocess, multiprocessing, os.fork(), concurrent.futures, and loky out of the box.
For more general multi-process cases, VizTracer can support with some extra steps.
Refer to multi process docs for details
VizTracer supports asyncio natively, but could enhance the report by using --log_async.
Refer to async docs for details
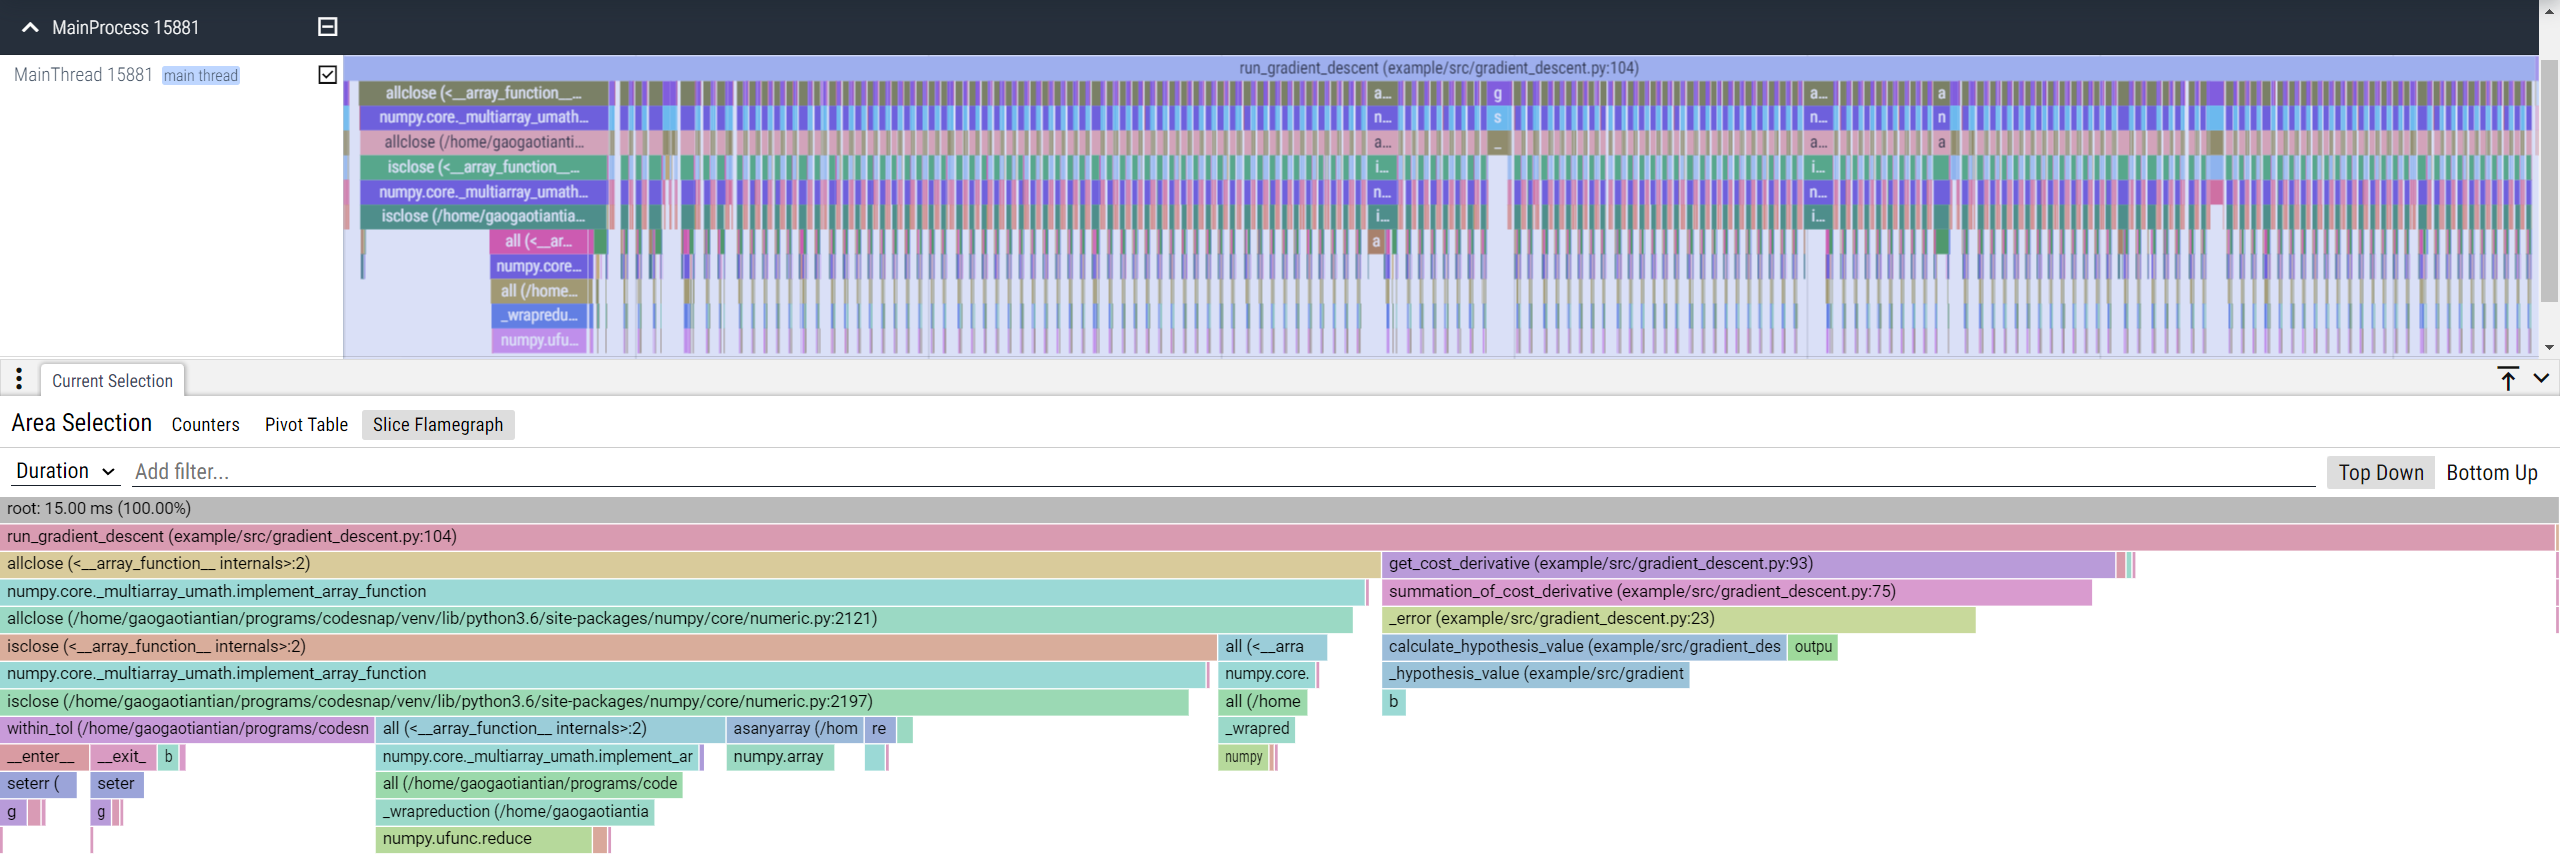
Perfetto supports native flamegraph, just select slices on the UI and choose "Slice Flamegraph".
VizTracer supports remote attach to an arbitrary Python process to trace it, as long as viztracer is importable
Refer to remote attach docs
VizTracer needs to dump the internal data to json format. It is recommended for the users to install orjson, which is much faster than the builtin json library. VizTracer will try to import orjson and fall back to the builtin json library if orjson does not exist.
VizTracer puts in a lot of effort to achieve low overhead. The actual performance impact largely depends on your application. For typical codebases, the overhead is expected to be below 1x. If your code has infrequent function calls, the overhead could be minimal.
Detailed explanation
The overhead introduced by VizTracer is basically a fixed amount of time during function entry and exit, so the more time spent on
function entries and exits, the more overhead will be observed. A pure recursive fib function could suffer 3x-4x overhead
on Python3.11+ (when the Python call is optimized, before that Python call was slower so the overhead ratio would be less).
In the real life scenario, your code should not spend too much time on function calls (they don't really do anything useful), so the overhead would be much smaller.
Many techniques are applied to minimize the overall overhead during code execution to reduce the inevitable skew introduced by
VizTracer (the report saving part is not as critical). For example, VizTracer tries to use the CPU timestamp counter instead of
a syscall to get the time when available. On Python 3.12+, VizTracer uses sys.monitoring which has less overhead than
sys.setprofile. All of the efforts made it observably faster than cProfile, the Python stdlib profiler.
However, VizTracer is a tracer, which means it has to record every single function entry and exit, so it can't be as fast as the sampling profilers - they are not the same thing. With the extra overhead, VizTracer provides a lot more information than normal sampling profilers.
For full documentation, please see https://viztracer.readthedocs.io/en/stable
Please send bug reports and feature requests through github issue tracker. VizTracer is currently under development now and it's open to any constructive suggestions.
Copyright 2020-2025 Tian Gao.
Distributed under the terms of the Apache 2.0 license.
