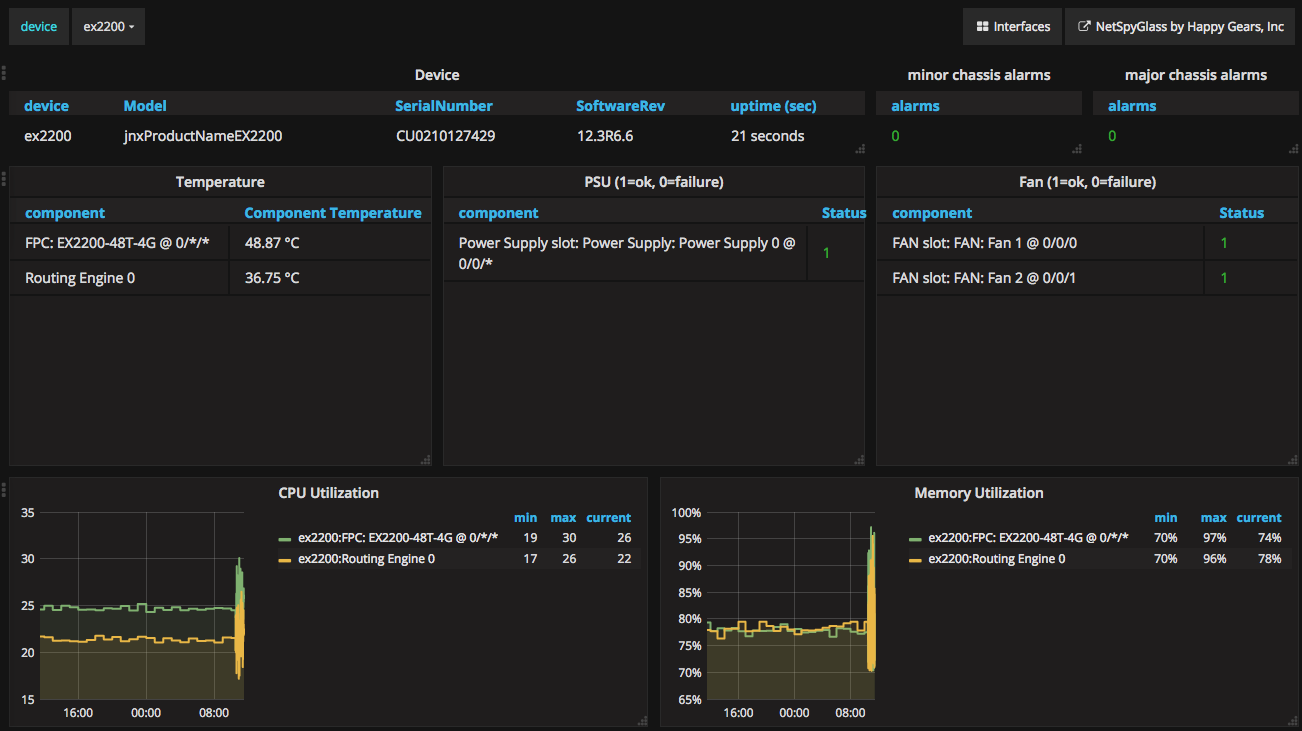
This data source enabled Grafana to query metrics collected and stored by NetSpyGlass server.
NetSpyGlass is integrated network mapping and monitoring system that presents live monitoring data as series of animated network maps. NetSpyGlass discovers your network using SNMP, builds a model that represents Layer2 connections and automatically configures itself to monitor all aspects of network devices and servers, striving to be useful “out of the box” with very little initial configuration and ongoing maintenance.
Administrator can write Python scripts that run inside of the server on every polling interval. These scripts operate with monitoring data and can be used to calculate new metrics derived from the collected "raw" data, for example various aggregates. Results produced by these scripts become part of the general data pool and are available for graphing with Grafana, as well as for alerts and reports.
NetSpyGlass requires little effort to set up and keep up with your network as it grows and can scale to thousands of devices and millions of metrics.
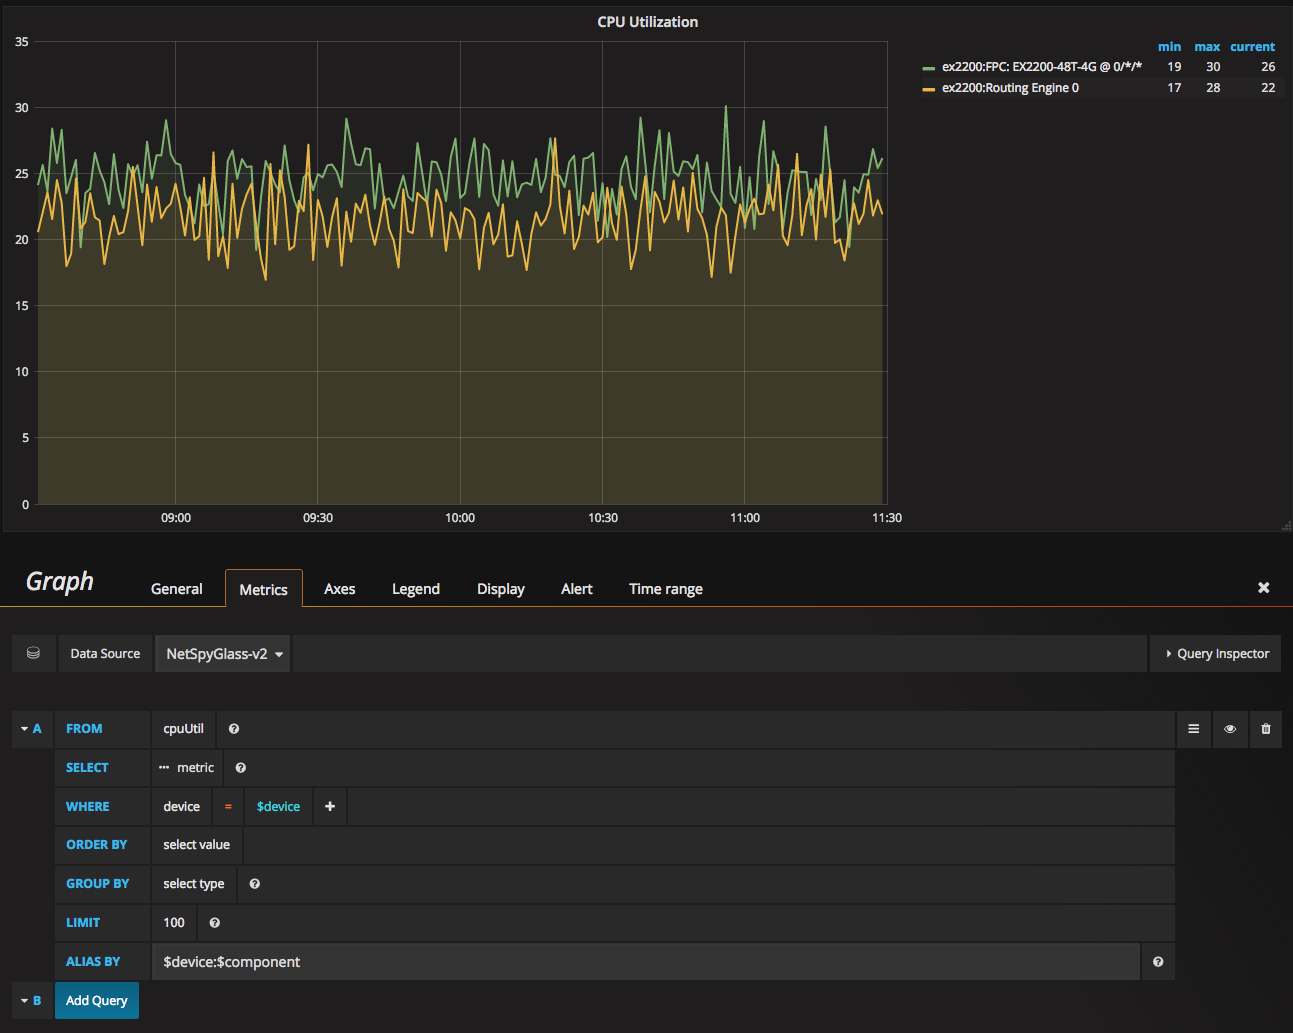
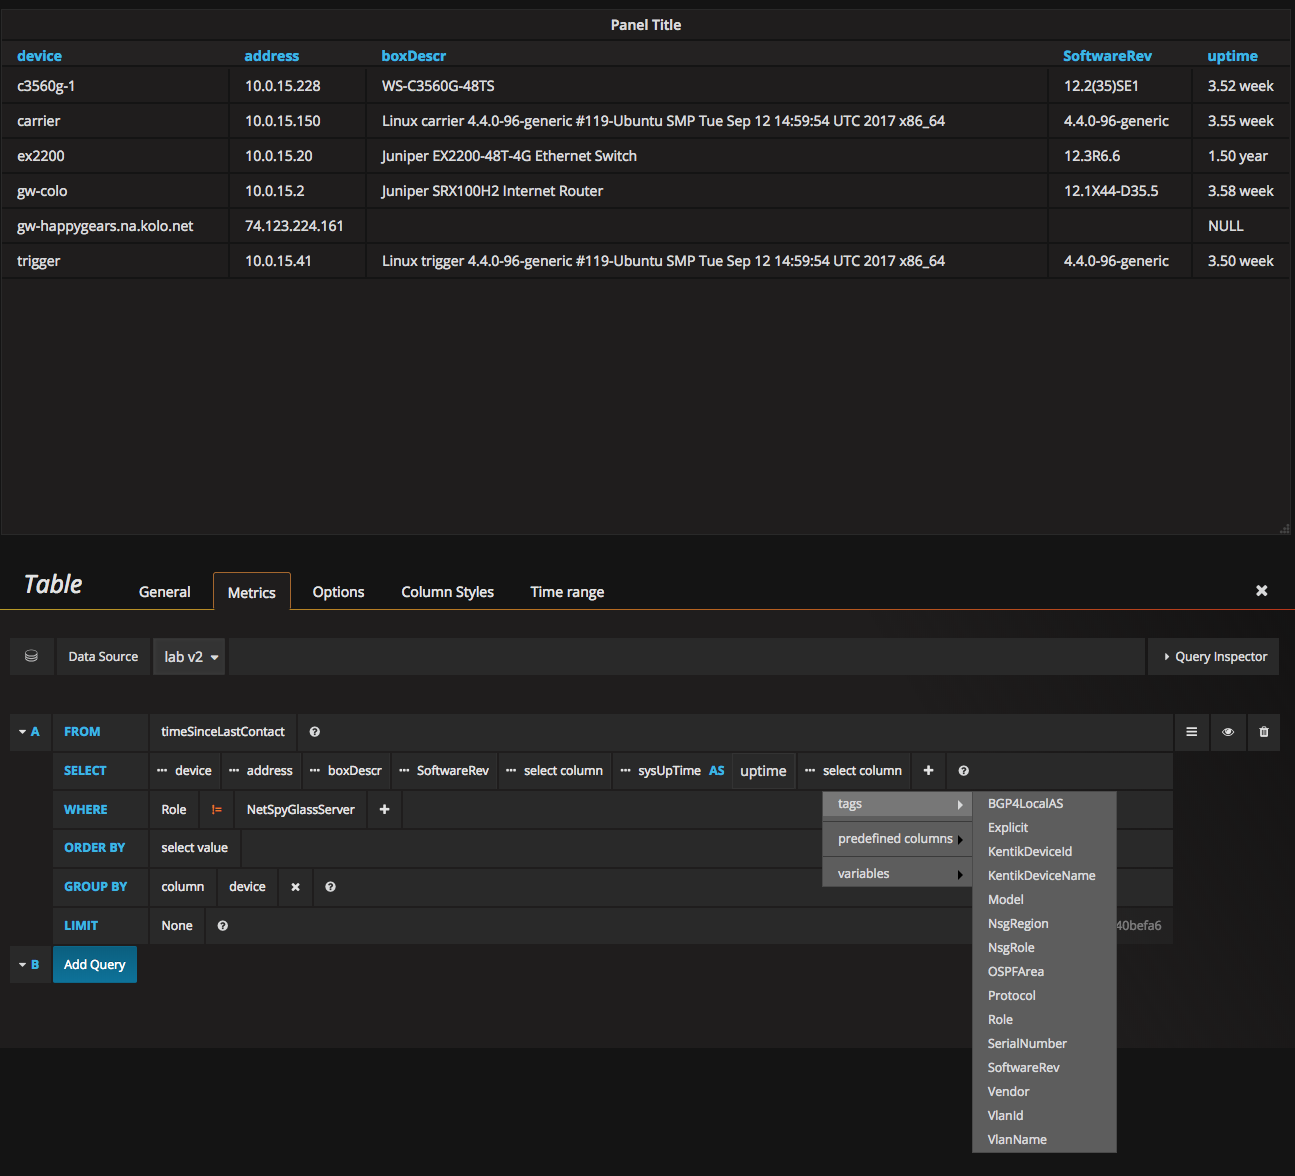
- Data Source plugin provides a flexible query editor with device, component and tags match
- Data queries use SQL-like syntax (called NsgQL )
- The user can build queries using by choosing variables, matching operators and attributes, and other parameters using drop-down lists, or by typing NsgQL query manually
- Data Source supports Graph, Table, and Singlestat panels
- Dashboard template variables and ad-hoc filters are supported
- With this plugin, Grafana makes queries directly to NetSpyGlass server to receive lists of available metrics, devices, components and tags. This means it is agnostic with respect to the time series database used by the NetSpyGlass server and can work with any of them (rrd, graphite, InfluxDb, hbase)
- clone this git repository
- run script
./tools/maketar.sh. This script produces archivenetspyglass-datasource-v2.tar - Copy this archive to the server where Grafana runs and unpack it in
the directory
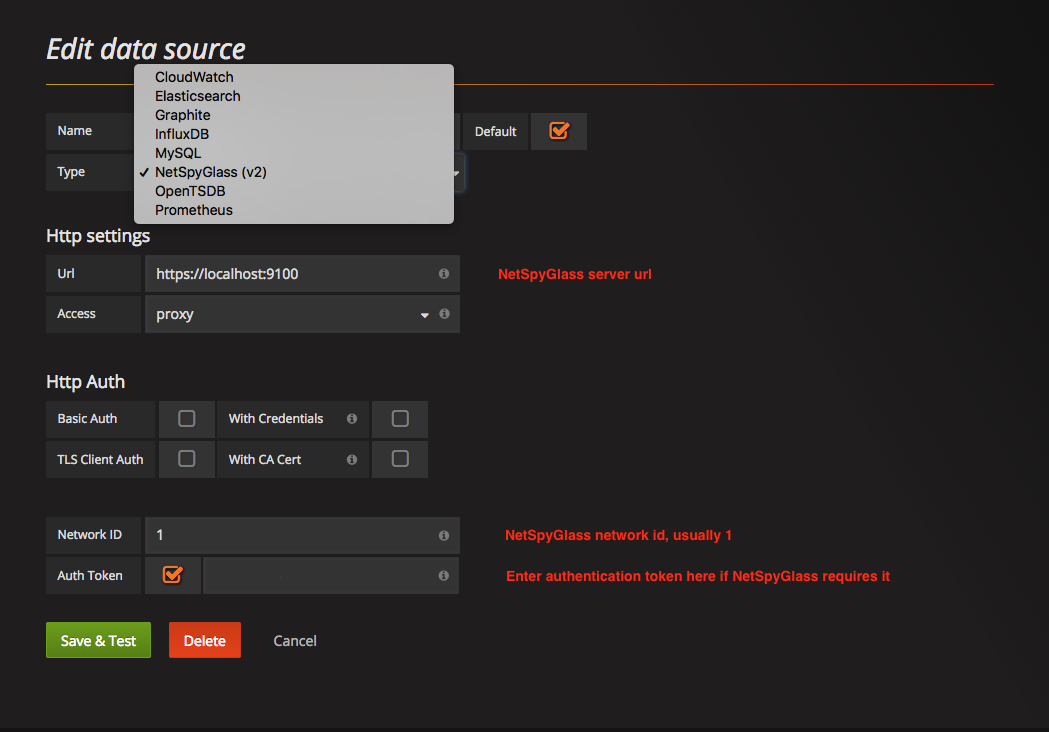
/var/lib/grafana/plugins/, then restart the server with commandsudo service grafana-server restart. - After the restart, NetSpyGlass should appear in the list of available
data sources. If your NetSpyGlass server requires user authentication,
add enable and configure access token. The token is set in NetSpyGlass
configuration file
nw2.confusing parameter keyapi.accessTokens.grafana - Click "Add" and then "Save and Test" to test communication with the server
Data Source configuration:
(C) 2019 Happy Gears, Inc www.happygears.net
Grafana plugin for NetSpyGlass is licensed under the Apache 2.0 License
improvements to the query builder dialog, support for new NsgQL functions
- In this version of the plugin, we have completely changed the approach to getting data from the server, so this version is not compatible with the older ones. The server API was changed to a SQL-like syntax ( NsgQL ). The query builder is implemented from scratch in a more modern form.
- fixed regression caused by the switch to lodash 4.x. This bug broke time intervals "today", "yesterday" and others like that.
- Fixed regression caused by "Grafana" bug #6912 that break ability to build queries/fields.
- fixed bug that prevented the data source from properly fetching graph data for graphs with fixed time intervals or time intervals in the past, such as "yesterday" or "day before yesterday"
- made it possible to use dashboard template variables in "ALIAS BY" query field.
- download and install nodejs from link. This package also includes npm.
- Clone this git repository
git clone [email protected]:happygears/netspyglass-grafana.git - Go to the cloned folder
cd netspyglass-grafana - Run
npm install - Use one of the following commands:
grunt watch# execute this command during development. It will rebuild project on every file change detection.npm run build# make a development buildnpm run build-prod# make a production build with tests and patch versionnpm run build-prod:minor# make a production build with tests and bump minor versionnpm run build-prod:major# make a production build with tests and bump major version


