Skip to content
New issue

Have a question about this project? Sign up for a free GitHub account to open an issue and contact its maintainers and the community.

By clicking “Sign up for GitHub”, you agree to our terms of service and privacy statement. We’ll occasionally send you account related emails.

Already on GitHub? Sign in to your account

Hardening: FireFly Hardening & Performance Testing - umbrella issue #316

Open
shorsher opened this issue Nov 10, 2021 · 14 comments
Open

Hardening: FireFly Hardening & Performance Testing - umbrella issue #316

shorsher opened this issue Nov 10, 2021 · 14 comments
Assignees
Milestone

Comments

@shorsher
Copy link
Member

Part of the 1.0 milestone #117 includes a number of performance tests on FireFly core.
They are:

  • Throughput and latency measurement
  • Bottleneck analysis & triage
  • Multi-day soak testing
  • HA fail-over testing

This issue will track the ongoing efforts to complete these per protocol.

@shorsher
Copy link
Member Author

shorsher commented Nov 10, 2021

Ethereum Throughput and Latency Measurement

Goals:

  • Hit FireFly with a sustained, moderate (TBD) amount of load to be confident there are no issues processing transactions.
  • Initial performance benchmarks e.g. throughput, latency

Please note the initial goal of this exercise is not to slam FireFly with as much RPS as possible. It's much more important for us to be confident in FireFly's performance under somewhat normal conditions.

Interfaces targeted:

  • Broadcasts
  • Private Messages
  • Minting tokens

Desirable metrics:

  • E2E latency
  • Success ratio
  • .....

Test Scenarios:

  1. Send pinned (broadcasts, private message, token mints) with data
  2. Verify each broadcast was successfully sent, transaction processed, and received.

Tools under consideration:

@shorsher
Copy link
Member Author

shorsher commented Nov 15, 2021

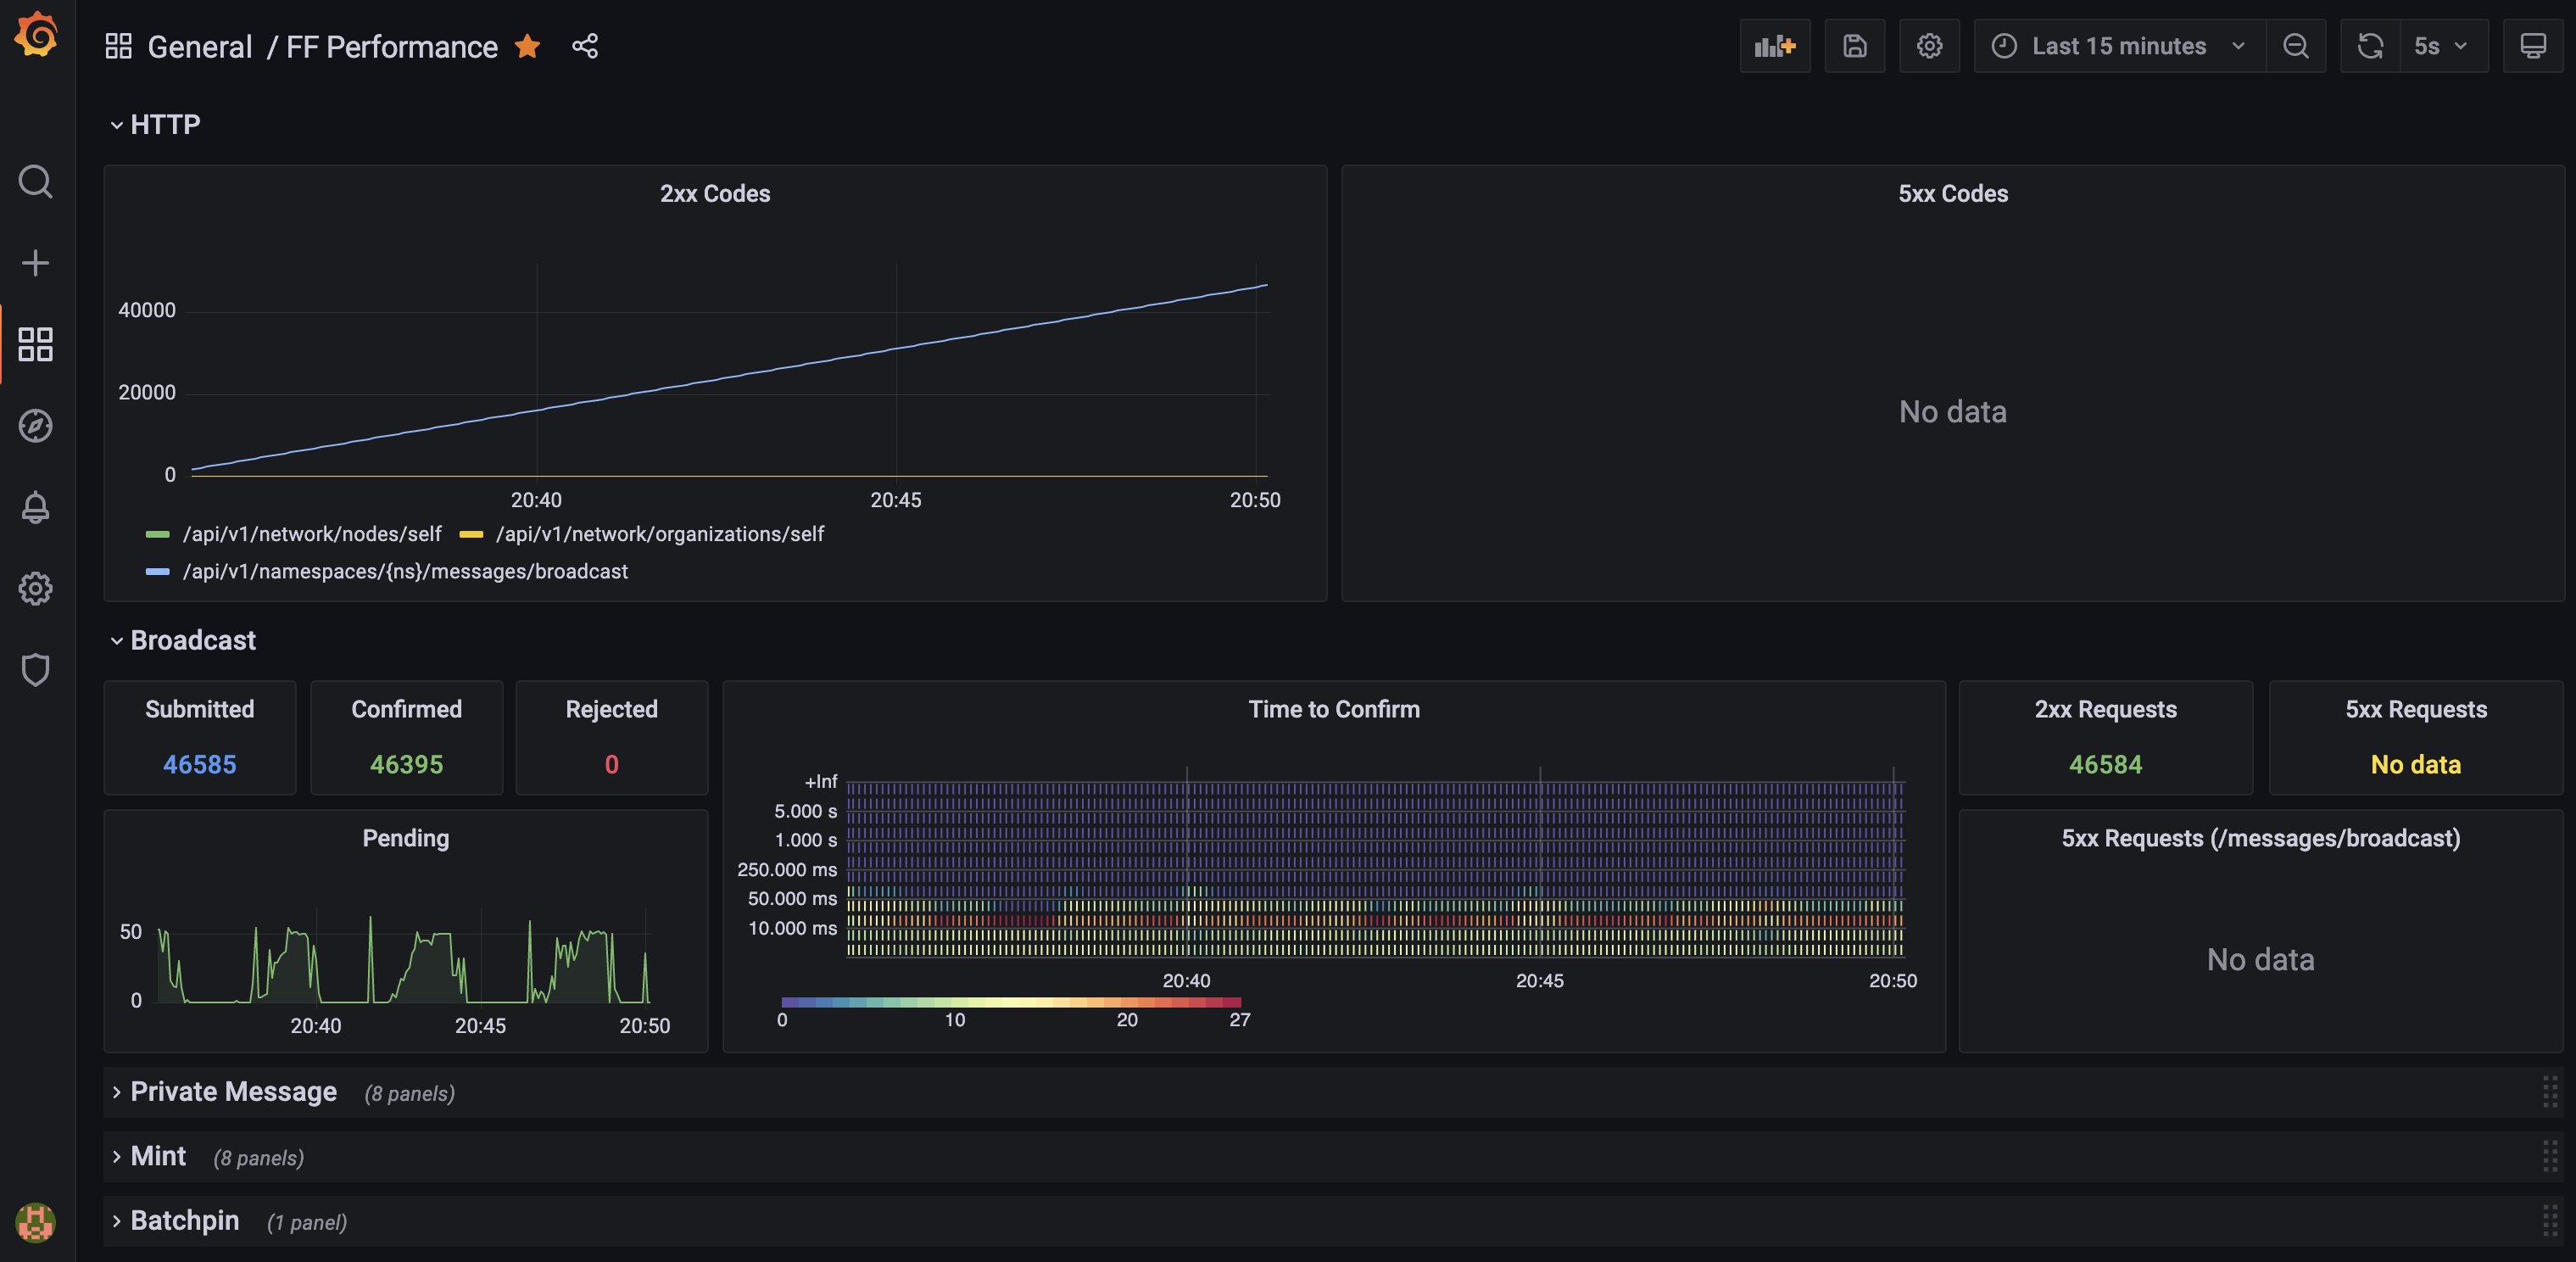
Here's an overview of the tooling being used so far.

perf.go is a small script that utilizes vegeta to simulate load. Currently, it focuses on two categories of metrics:

  1. The time between the last message sent and 0 pending transactions.
  2. How FireFly responds to load e.g. latency, failure rate, sustained RPS (Requests Per Second).

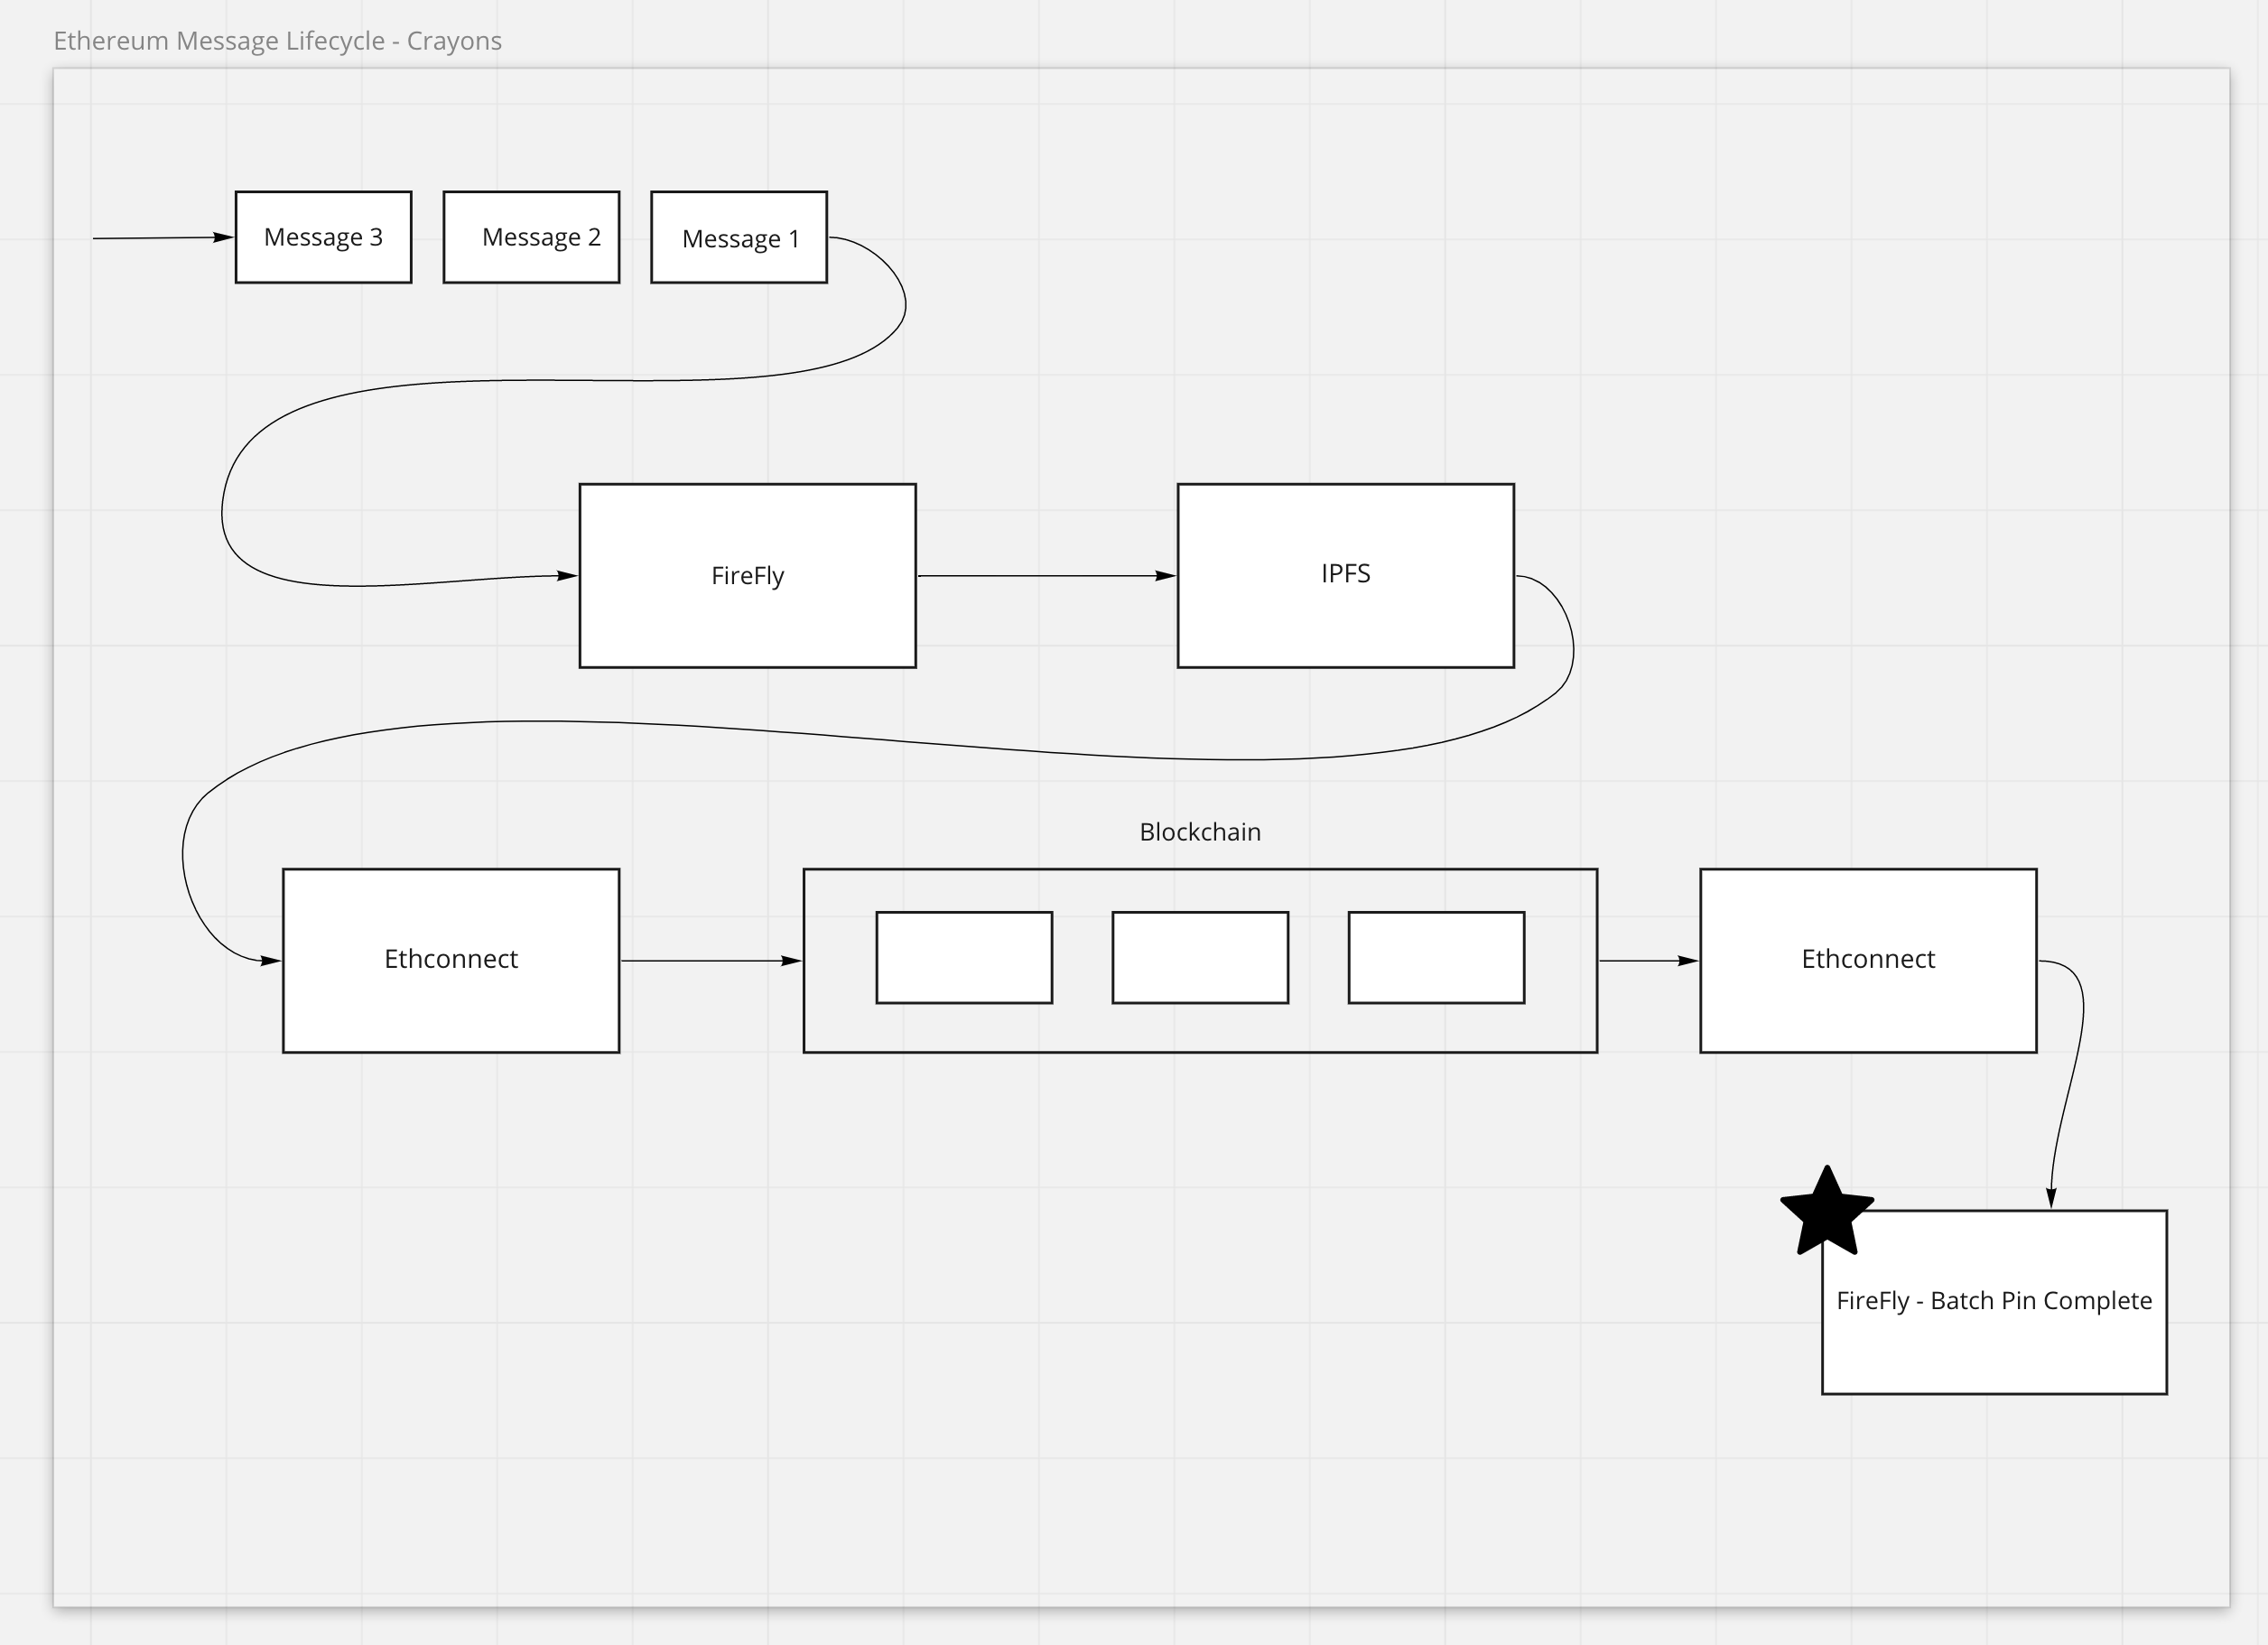
For reference, all testing is currently being done on a 2 node FireFly network, using postgres as the DB layer, generated by FireFly CLI.

Here are the some example outputs from perf.go with extremely low RPS:

10 RPS:

Requests      [total, rate, throughput]         600, 10.02, 10.01
Duration      [total, attack, wait]             59.917s, 59.898s, 19.263ms
Latencies     [min, mean, 50, 90, 95, 99, max]  5.517ms, 23.619ms, 12.784ms, 53.92ms, 67.832ms, 100.943ms, 159.004ms
Bytes In      [total, mean]                     355740, 592.90
Bytes Out     [total, mean]                     74400, 124.00
Success       [ratio]                           100.00%
Status Codes  [code:count]                      202:600
Error Set:
Elapsed time between last sent message and 0 pending transactions: 8.011959383s

20 RPS:

Requests      [total, rate, throughput]         1200, 20.02, 19.97
Duration      [total, attack, wait]             1m0s, 59.95s, 153.045ms
Latencies     [min, mean, 50, 90, 95, 99, max]  5.326ms, 36.946ms, 30.048ms, 77.708ms, 91.476ms, 130.316ms, 197.948ms
Bytes In      [total, mean]                     711476, 592.90
Bytes Out     [total, mean]                     148800, 124.00
Success       [ratio]                           100.00%
Status Codes  [code:count]                      202:1200
Error Set:
Elapsed time between last sent message and 0 pending transactions: 10.016299835s

30 RPS:

Requests      [total, rate, throughput]         1800, 30.02, 29.96
Duration      [total, attack, wait]             1m0s, 59.966s, 114.93ms
Latencies     [min, mean, 50, 90, 95, 99, max]  5.155ms, 77.104ms, 55.077ms, 171.714ms, 230.911ms, 353.897ms, 619.305ms
Bytes In      [total, mean]                     1067202, 592.89
Bytes Out     [total, mean]                     223200, 124.00
Success       [ratio]                           100.00%
Status Codes  [code:count]                      202:1800
Error Set:
Elapsed time between last sent message and 0 pending transactions: 35.023299044s

40 RPS:

Requests      [total, rate, throughput]         2400, 40.02, 39.98
Duration      [total, attack, wait]             1m0s, 59.977s, 54.962ms
Latencies     [min, mean, 50, 90, 95, 99, max]  4.643ms, 48.976ms, 39.996ms, 100.161ms, 119.713ms, 152.931ms, 211.914ms
Bytes In      [total, mean]                     1422923, 592.88
Bytes Out     [total, mean]                     297600, 124.00
Success       [ratio]                           100.00%
Status Codes  [code:count]                      202:2400
Error Set:
Elapsed time between last sent message and 0 pending transactions: 52.081265919s

50 RPS:

Requests      [total, rate, throughput]         3000, 50.02, 49.98
Duration      [total, attack, wait]             1m0s, 59.979s, 41.133ms
Latencies     [min, mean, 50, 90, 95, 99, max]  11.924ms, 54.866ms, 28.605ms, 72.405ms, 111.312ms, 798.671ms, 1.515s
Bytes In      [total, mean]                     1775629, 591.88
Bytes Out     [total, mean]                     372000, 124.00
Success       [ratio]                           100.00%
Status Codes  [code:count]                      202:3000
Error Set:
Elapsed time between last sent message and 0 pending transactions: 1m21.009812988s

The current goal is identifying what is causing the high time between the last message and 0 pending transactions. Below is a diagram of the lifecycle of a pinned message in FireFly:

Screen Shot 2021-11-15 at 4 17 05 PM

The starred box, "FireFly - Batch Pin Complete", is where batches from confirmed transactions are sequentially processed in FireFly. In the 50 RPS test, a batch was taking ~4 seconds to process, with ~120 messages per batch. The bulk of those 4 seconds was making DB queries for each message, where each message was taking roughly 25ms to process.

@peterbroadhurst is investigating a way to reduce processing time by limiting the number of DB queries per message.

@shorsher
Copy link
Member Author

shorsher commented Nov 18, 2021

With @peterbroadhurst's changes in #325, batch processing has been improved 4x. Taking roughly 1second, down from 4seconds, to fully process each batch.

@shorsher
Copy link
Member Author

shorsher commented Nov 19, 2021

Here are some comparison results for context. All benchmarks were ran on my MBP with a CLI generated 2 node firefly environment, using postgres as the DB:

Before #325, we were consistently seeing > 1 minute latency between the last sent message and 0 pending transactions.

Requests      [total, rate, throughput]         3000, 50.02, 49.98
Duration      [total, attack, wait]             1m0s, 59.979s, 41.133ms
Latencies     [min, mean, 50, 90, 95, 99, max]  11.924ms, 54.866ms, 28.605ms, 72.405ms, 111.312ms, 798.671ms, 1.515s
Bytes In      [total, mean]                     1775629, 591.88
Bytes Out     [total, mean]                     372000, 124.00
Success       [ratio]                           100.00%
Status Codes  [code:count]                      202:3000
Error Set:
Elapsed time between last sent message and 0 pending transactions: 1m21.009812988s
Requests      [total, rate, throughput]         3000, 50.02, 49.76
Duration      [total, attack, wait]             1m0s, 59.98s, 303.142ms
Latencies     [min, mean, 50, 90, 95, 99, max]  13.387ms, 175.692ms, 85.487ms, 292.843ms, 1.018s, 1.437s, 1.947s
Bytes In      [total, mean]                     1775678, 591.89
Bytes Out     [total, mean]                     372000, 124.00
Success       [ratio]                           100.00%
Status Codes  [code:count]                      202:3000
Error Set:
Elapsed time between last sent message and 0 pending transactions: 1m59.015816118s

With #325:

Duration      [total, attack, wait]             59.991s, 59.977s, 14.409ms
Latencies     [min, mean, 50, 90, 95, 99, max]  9.681ms, 42.796ms, 21.667ms, 62.05ms, 105.421ms, 650.269ms, 1.123s
Bytes In      [total, mean]                     1775694, 591.90
Bytes Out     [total, mean]                     372000, 124.00
Success       [ratio]                           100.00%
Status Codes  [code:count]                      202:3000
Error Set:
Elapsed time between last sent message and 0 pending transactions: 15.009402704s
Requests      [total, rate, throughput]         3000, 50.02, 49.96
Duration      [total, attack, wait]             1m0s, 59.977s, 64.636ms
Latencies     [min, mean, 50, 90, 95, 99, max]  9.85ms, 22.499ms, 19.238ms, 36.131ms, 46.965ms, 71.564ms, 167.495ms
Bytes In      [total, mean]                     1775656, 591.89
Bytes Out     [total, mean]                     372000, 124.00
Success       [ratio]                           100.00%
Status Codes  [code:count]                      202:3000
Error Set:
Elapsed time between last sent message and 0 pending transactions: 10.005748929s
Requests      [total, rate, throughput]         3000, 50.02, 50.01
Duration      [total, attack, wait]             59.994s, 59.977s, 16.459ms
Latencies     [min, mean, 50, 90, 95, 99, max]  9.671ms, 32.417ms, 18.36ms, 33.254ms, 45.816ms, 597.197ms, 1.161s
Bytes In      [total, mean]                     1775683, 591.89
Bytes Out     [total, mean]                     372000, 124.00
Success       [ratio]                           100.00%
Status Codes  [code:count]                      202:3000
Error Set:
Elapsed time between last sent message and 0 pending transactions: 10.007021619s

Batch processing time was consistently reduced to <= 1, down from ~4.

[2021-11-17T10:29:40.179-05:00]  INFO -> BatchPinComplete batch=f805835c-bc87-41ba-9b4b-e1ce2056369d txn=0xcbc2e712857072b33e50ef40bcd5394699dc4c05645800a49fd0a89a49bd078e signingIdentity=0x447dd9c1170480748ab4fe9717bdc5e96667e55d pid=57135 role=event-manager
......
[2021-11-17T10:29:40.391-05:00]  INFO <- BatchPinComplete batch=f805835c-bc87-41ba-9b4b-e1ce2056369d txn=0xcbc2e712857072b33e50ef40bcd5394699dc4c05645800a49fd0a89a49bd078e signingIdentity=0x447dd9c1170480748ab4fe9717bdc5e96667e55d pid=57135 role=event-manager

Closing out initial broadcast tests here.

@shorsher
Copy link
Member Author

shorsher commented Dec 5, 2021

Seeing some good results with pinned private messages

Requests      [total, rate, throughput]         3000, 50.02, 49.99
Duration      [total, attack, wait]             1m0s, 59.978s, 28.515ms
Latencies     [min, mean, 50, 90, 95, 99, max]  19.938ms, 35.958ms, 27.828ms, 59.743ms, 70.459ms, 98.082ms, 173.507ms
Bytes In      [total, mean]                     1994674, 664.89
Bytes Out     [total, mean]                     615000, 205.00
Success       [ratio]                           100.00%
Status Codes  [code:count]                      202:3000
Error Set:
Elapsed time between last message and 0 pending transactions: 1.016668037s
Requests      [total, rate, throughput]         3000, 50.02, 49.98
Duration      [total, attack, wait]             1m0s, 59.977s, 26.722ms
Latencies     [min, mean, 50, 90, 95, 99, max]  19.739ms, 31.028ms, 27.131ms, 44.154ms, 56.449ms, 89.647ms, 158.406ms
Bytes In      [total, mean]                     1994131, 664.71
Bytes Out     [total, mean]                     615000, 205.00
Success       [ratio]                           99.97%
Status Codes  [code:count]                      202:2999  500:1
Error Set:
500 Internal Server Error
Elapsed time between last message and 0 pending transactions: 1.01232381s

@shorsher
Copy link
Member Author

shorsher commented Dec 5, 2021

Now, the focus is on testing tokens. After discussion with @awrichar, we've decided on the following order of tests:

  1. Mint without message
  2. Mint with message
  3. Transfer
  4. Burn

Currently, tokens does not batch transactions before submitting to ethconnect, so the results at high RPS should be interesting.

@shorsher
Copy link
Member Author

shorsher commented Dec 8, 2021

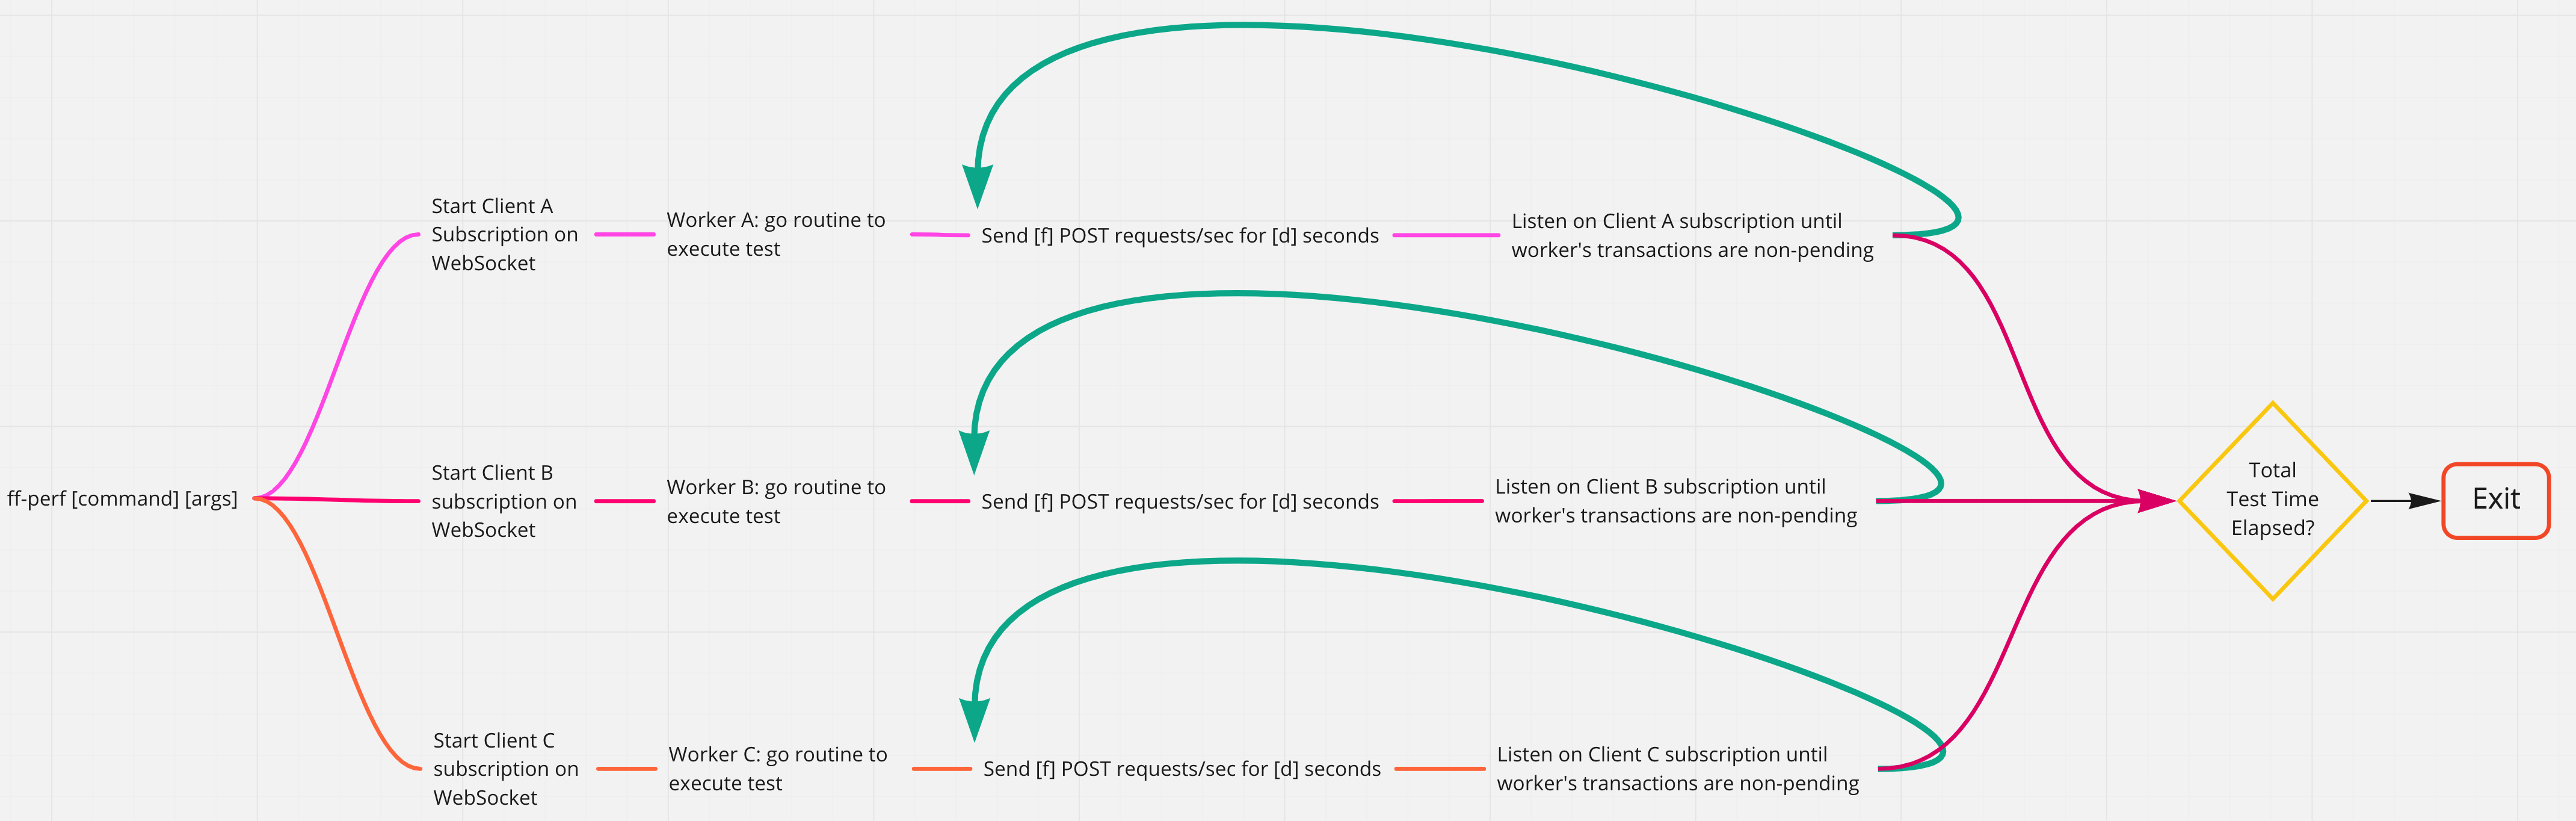
The above mentioned perf.go has turned into an official CLI tool🎉 . firefly-perf-cli is the HTTP load testing tool we are using for performance testing & hardening.

@dechdev
Copy link
Contributor

dechdev commented Jan 2, 2022

Since the creation of firefly-perf-cli, improvements have been made to performance testing mechanics. These include utilizing goroutines to kick off vegeta jobs, websockets to confirm transactions, running tests in an EC2 instance rather than locally, and tracking and viewing results with Prometheus and Grafana.

Architecture

image

Grafana Dashboard - Broadcasts (50 tx/sec)

grafana

@peterbroadhurst
Copy link
Contributor

Would be great to put this architecture diagram into the README when you get a chance 🚀 🤖

@dechdev
Copy link
Contributor

dechdev commented Jan 3, 2022

#376 - Database change event queue gets exhausted (Closed)

@dechdev
Copy link
Contributor

dechdev commented Jan 5, 2022

#380 - Database begin transaction failed: pq: too many clients already (Closed)

@dechdev
Copy link
Contributor

dechdev commented Jan 5, 2022

#382 - Error from data exchange - request entity too large

@dechdev
Copy link
Contributor

dechdev commented Jan 6, 2022

#383 - Token transfer has already been recorded

@nguyer nguyer changed the title FireFly Hardening & Performance Testing Plan FireFly Hardening & Performance Testing Jan 10, 2022
@nguyer nguyer added this to the v1.0.0 milestone Jan 10, 2022
@nguyer nguyer added this to FireFly Jan 10, 2022
@nguyer nguyer moved this to In Progress in FireFly Jan 10, 2022
@dechdev
Copy link
Contributor

dechdev commented Jan 11, 2022

#406 - Mismatched nexthash or author (Fabric)

@peterbroadhurst peterbroadhurst changed the title FireFly Hardening & Performance Testing Hardening: FireFly Hardening & Performance Testing - umbrella issue Mar 2, 2022
Sign up for free to join this conversation on GitHub. Already have an account? Sign in to comment
Labels
None yet
Projects
Status: In Progress
Development

No branches or pull requests

4 participants