A new version of the program to convert raw fluorescence data generated by Genepix™ microarray scanner to to expression data.
-
This program is initially designed for lectin microarray analysis (dual color and single color) but it is also applicable to the microarrays.
-
This program is integrated with a GUI (tkinter).
-
User can initiate the program by running the python file (.py) in an IDE on a machine with python 3.6 or above installed.
-
For users who do not wish to install python or IDE, a convenient, user-friendly version (for 64 bit windows only) is also provided (Microarray Analysis_Sep2021_win64.zip). See part III for instructions.
Changes in this version compared the last version:
- Now users can select fluorescence channels (available options: 635nm, 594nm, 532nm, 488nm)
- Now includes "conventional SNR" and "absolute intensity" options for signal cutoffs for more versatile analysis
- More infomation included in the output annotated raw file.
- Improved GUI
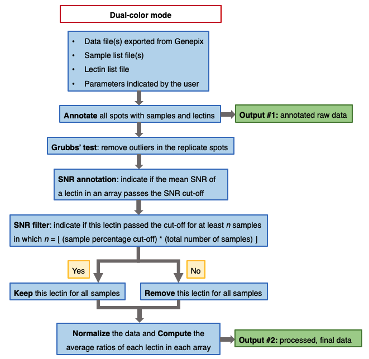
(1) Dual color mode
• A tab delimited text file containing the annotated raw data.
• A tab delimited text file containing the unadjusted/adjusted average ratios of each lectin for each sample.
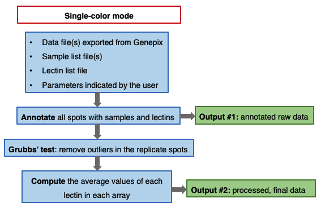
(2) Single color mode
• A tab delimited text file containing the annotated raw data.
• A tab delimited text file containing the average fluorescence values of each lectin for each sample.
    •	The files must be .txt files (the default output file format in Genepix).

    •	The program extracts data from the columns with the following names (case sensitive, note the spaces, columns names separated by comma) for calculation. Here only shows the columns when 635nm channel is used.

    Block, Column, F635 Median, F635 Median - B635, SNR 635, F635 Median, F635 Mean

    Making sure the names of these columns are correct is critical.
    •	The files must be .txt files (the default output file format in Genepix) or .csv files.

    •	The program ignores the first row of each sample list file. Therefore, the first row of each sample file can be basically any text (e.g., “sample”, “sample ID”)

    •	The number of samples in each sample list must match the corresponding raw data file.
    •	Only one file can be selected at a time.

    •	The file must be .txt file (the default output file format in Genepix) or .csv file.

    •	The program ignores the first row of the lectin list file. Therefore, the first row of the lectin list file can be basically any text (e.g., “lectin”, “lectin or antibody”)

    •	The number of lectins (including the spots with no probes) must match the corresponding raw data files.

    •	Important: this program assumes that starting from spot one, all replicates of a probe are next to each other in the raw data files.
    •	Multiple raw data files and sample list files can be selected at a time; the number of raw data files must be the same as the number of sample list  files.

    •	Users cannot select raw data files in different folders. This is also true when selecting sample list files.

    •	The raw data files are first sorted by FILE PATHS. Same for sample list files. Then the raw data files and sample list files are matched based on their position in the sorted queues.
-
Make sure required packages are installed: tkinter, numpy, pandas
-
Run the script. A user interface should appear on the screen.
-
Select input files, options and enter parameters using the user interface.
•	Number of replicates of lectins per array must be a positive integer

•	Grubbs’ test cut-off must be a positive real number

•	SNR cut-offs must be positive real numbers

•	Percentage sample cut-off must be a real number between 0 and 1
- Run analysis.
-
Unzip the file.
-
In the unzipped folder, find "Run analysis.bat" and open this file.
-
If a user interface appears on the screen, select input files, options and enter parameters:
•	Number of replicates of lectins per array must be a positive integer

•	Grubbs’ test cut-off must be a positive real number

•	SNR cut-offs must be positive real numbers

•	Percentage sample cut-off must be a real number between 0 and 1
- Run analysis.
Note:
• Do not change the content or the file names of the content of the folder.
• This only works on win64 platform.