k6 extension for publishing test-run metrics to Prometheus via Remote Write endpoint.
⚠️ Not to be confused with Prometheus Remote Write client extension which is for load testing Prometheus itself.
There are many options for remote-write compatible agents, the official list can be found here. The exact details of how metrics will be processed or stored depends on the underlying agent used.
Key points to know:
- remote write format does not contain explicit definition of any metric types while metadata definition is still in flux and can have different implementation depending on the remote-write compatible agent
- remote read is a separate interface and it is much less defined. For example, remote read may not work without precise queries; see here and here for details
- some remote-write compatible agents may support additional formats for remote write, like JSON, but it is not part of official Prometheus remote write specification and therefore absent here
To build k6 binary with the Prometheus remote write output extension use:
xk6 build --with github.com/grafana/xk6-output-prometheus-remote@latest
Then run new k6 binary with:
K6_PROMETHEUS_RW_SERVER_URL=http://localhost:9090/api/v1/write ./k6 run -o xk6-prometheus-rw script.js
Add TLS and HTTP basic authentication:
K6_PROMETHEUS_RW_SERVER_URL=https://localhost:9090/api/v1/write \
K6_PROMETHEUS_RW_INSECURE_SKIP_TLS_VERIFY=false \
K6_PROMETHEUS_RW_USERNAME=foo \
K6_PROMETHEUS_RW_PASSWORD=bar \
./k6 run -o xk6-prometheus-rw script.js
or with client certificate:
K6_PROMETHEUS_RW_SERVER_URL=https://localhost:9090/api/v1/write \
K6_PROMETHEUS_RW_INSECURE_SKIP_TLS_VERIFY=false \
K6_PROMETHEUS_RW_CLIENT_CERTIFICATE=client.crt \
K6_PROMETHEUS_RW_CLIENT_CERTIFICATE_KEY=client.key \
./k6 run -o xk6-prometheus-rw script.js
All the k6 metric types are converted into an equivalent Prometheus' type:
| k6 | Prometheus |
|---|---|
| Counter | Counter |
| Gauge | Gauge |
| Rate | Gauge |
| Trend | Gauges / Native Histogram |
The obvious conversion with a classic Prometheus Histogram is not convenient because k6 can't determine the fixed buckets in advance, so the Output maps a Trend metric by default into a Gauge representing p(99). It is possible to map the same Trend to multiple stats at the same time (count, sum, min, max, avg, med, p(x)), it is possible to specify them via the K6_PROMETHEUS_RW_TREND_STATS environment variable (e.g K6_PROMETHEUS_RW_TREND_STATS=avg,p(90),p(99),min,max). Note that for each added stat a new time series will be generated.
Mapping Trend by stats has the following cons:
- It is impossible to aggregate some Gauge's value (especially the percentiles).
- It uses a memory-expensive k6's data structure.
The previous points can be resolved by mapping Trend as Prometheus Native Histogram. Enabling the conversion by the K6_PROMETHEUS_RW_TREND_AS_NATIVE_HISTOGRAM=true environment variable (or one of the other ways), then the Output converts all the Trend types into a dedicated Native Histogram.
Native Histogram is a Prometheus' experimental feature, so it has to be enabled (--enable-feature=native-histograms). Note that other Remote-write implementations don't support it yet.
To enable remote write in Prometheus 2.x use --enable-feature=remote-write-receiver option. See docker-compose samples in example/. Options for remote write storage can be found here.
This repo includes a docker-compose.yml file that starts Prometheus, Grafana, and a custom build of k6 having the xk6-output-prometheus-remote extension.
Note: the docker-compose.yml file has the Native Histogram mapping set as enabled.
This is just a quick setup to show the usage. For a real use case, you will want to deploy outside of docker.
Clone the repo to get started and follow these steps:
-
Start the docker compose environment.
docker-compose up -d
Some users have encountered failures for the k6 build portion. A workaround may be to disable the "Use Docker Compose V2" checkbox in the General section of Docker Desktop settings.
# Output
Creating xk6-output-prometheus-remote_grafana_1     ... done
Creating xk6-output-prometheus-remote_prometheus_1  ... done
Creating xk6-output-prometheus-remote_k6_1          ... done
-
Use the k6 Docker image to run the k6 script and send metrics to the Prometheus container started on the previous step. You must set the
testidtag with a unique identifier to segment the metrics into discrete test runs for the Grafana dashboards.docker-compose run --rm -T k6 run -<samples/test.js --tag testid=<SOME-ID>
For convenience, the
docker-run.shcan be used to simply:./docker-run.sh samples/test.js
-
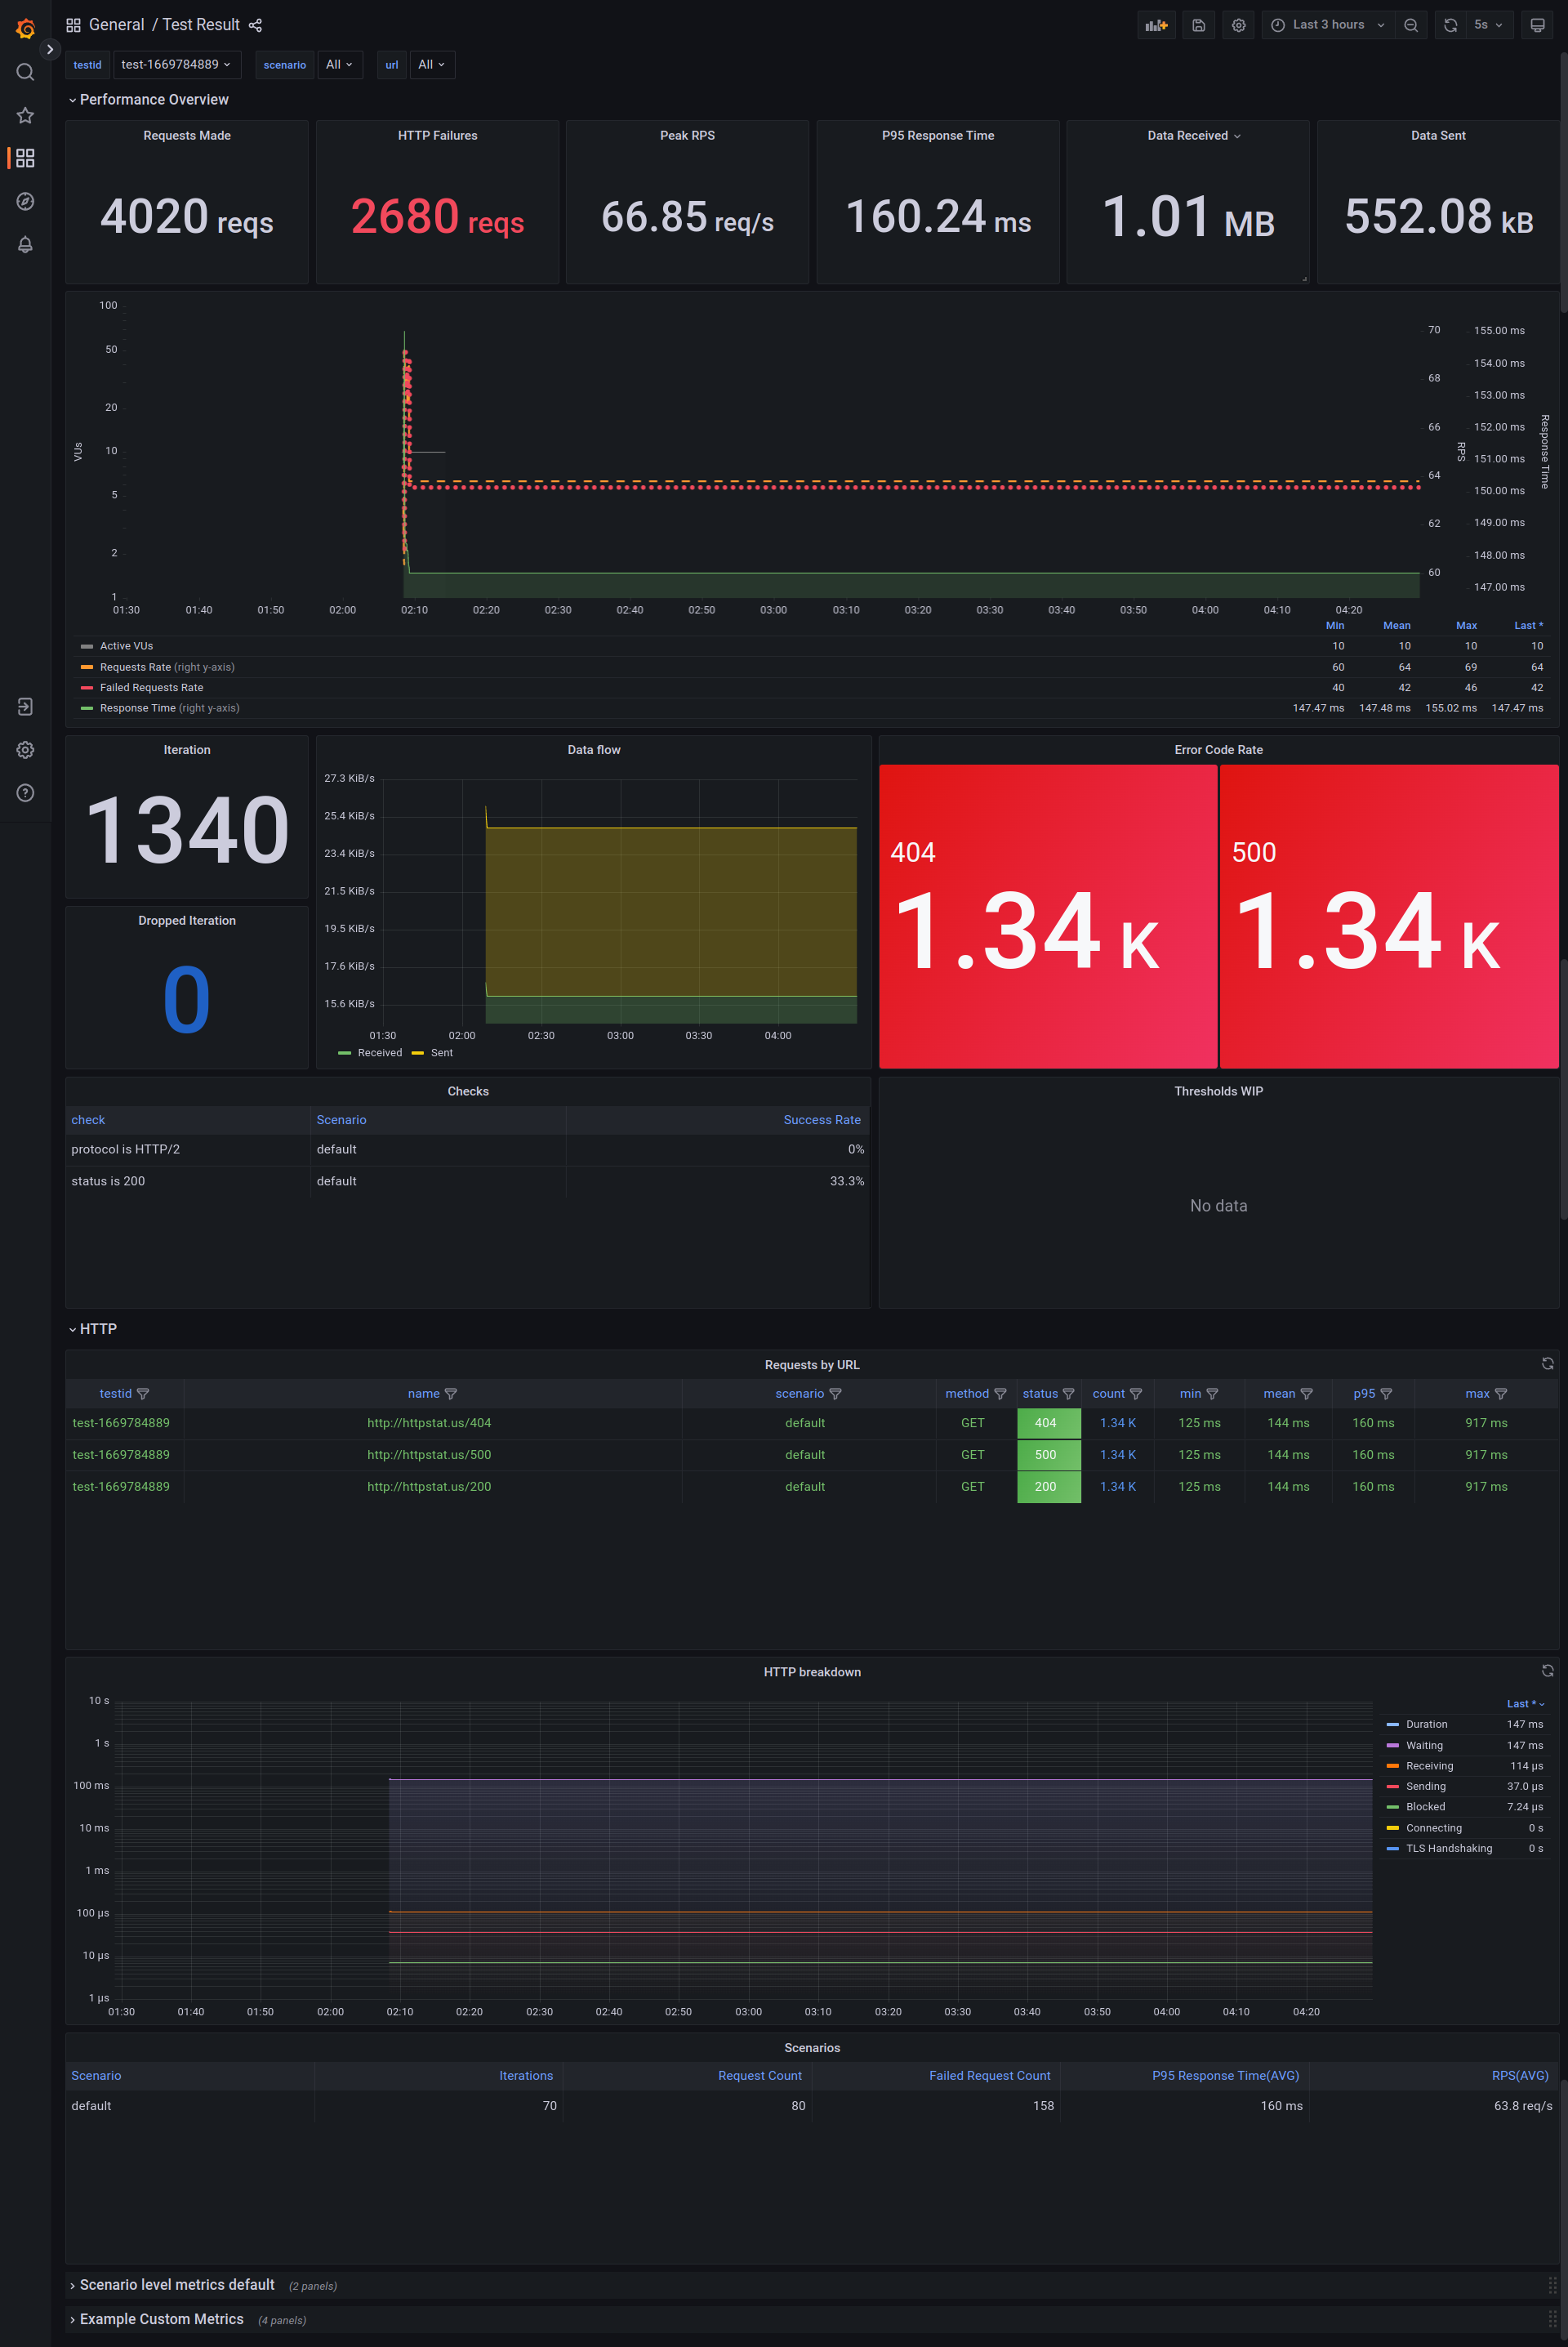
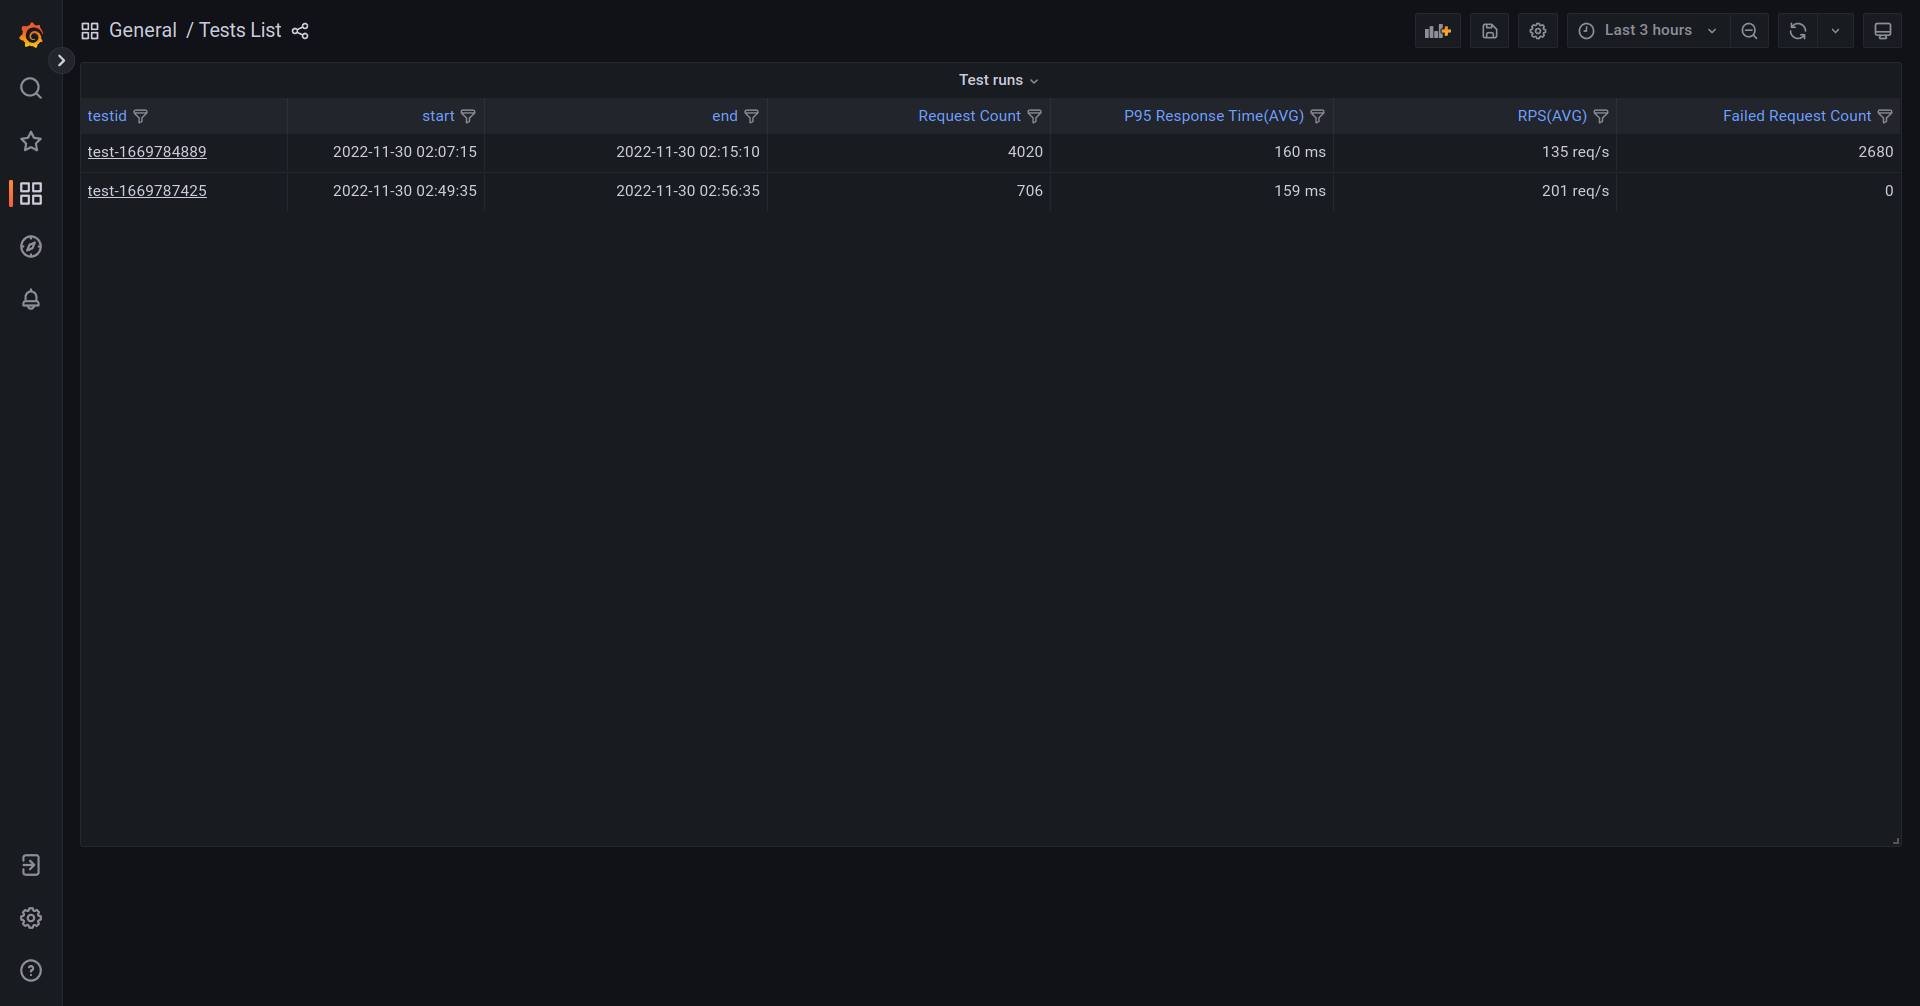
Visit http://localhost:3000/ to view results in Grafana.
The docker-compose setup comes with two pre-built Grafana dashboards. One for listing the discrete test runs as a list, and the other for visualizing the results of a specific test run.
Note: The dashboards work with the Native Histogram mapping so it is required to enable it.

