Meet the easiest way to generate SLOs for Prometheus.
Sloth generates understandable, uniform and reliable Prometheus SLOs for any kind of service. Using a simple SLO spec that results in multiple metrics and multi window multi burn alerts.
https://sloth.dev
- Simple, maintainable and understandable SLO spec.
- Reliable SLO metrics and alerts.
- Based on Google SLO implementation and multi window multi burn alerts framework.
- Autogenerates Prometheus SLI recording rules in different time windows.
- Autogenerates Prometheus SLO metadata rules.
- Autogenerates Prometheus SLO multi window multi burn alert rules (Page and warning).
- SLO spec validation (including
validatecommand for Gitops and CI). - Customization of labels, disabling different type of alerts...
- A single way (uniform) of creating SLOs across all different services and teams.
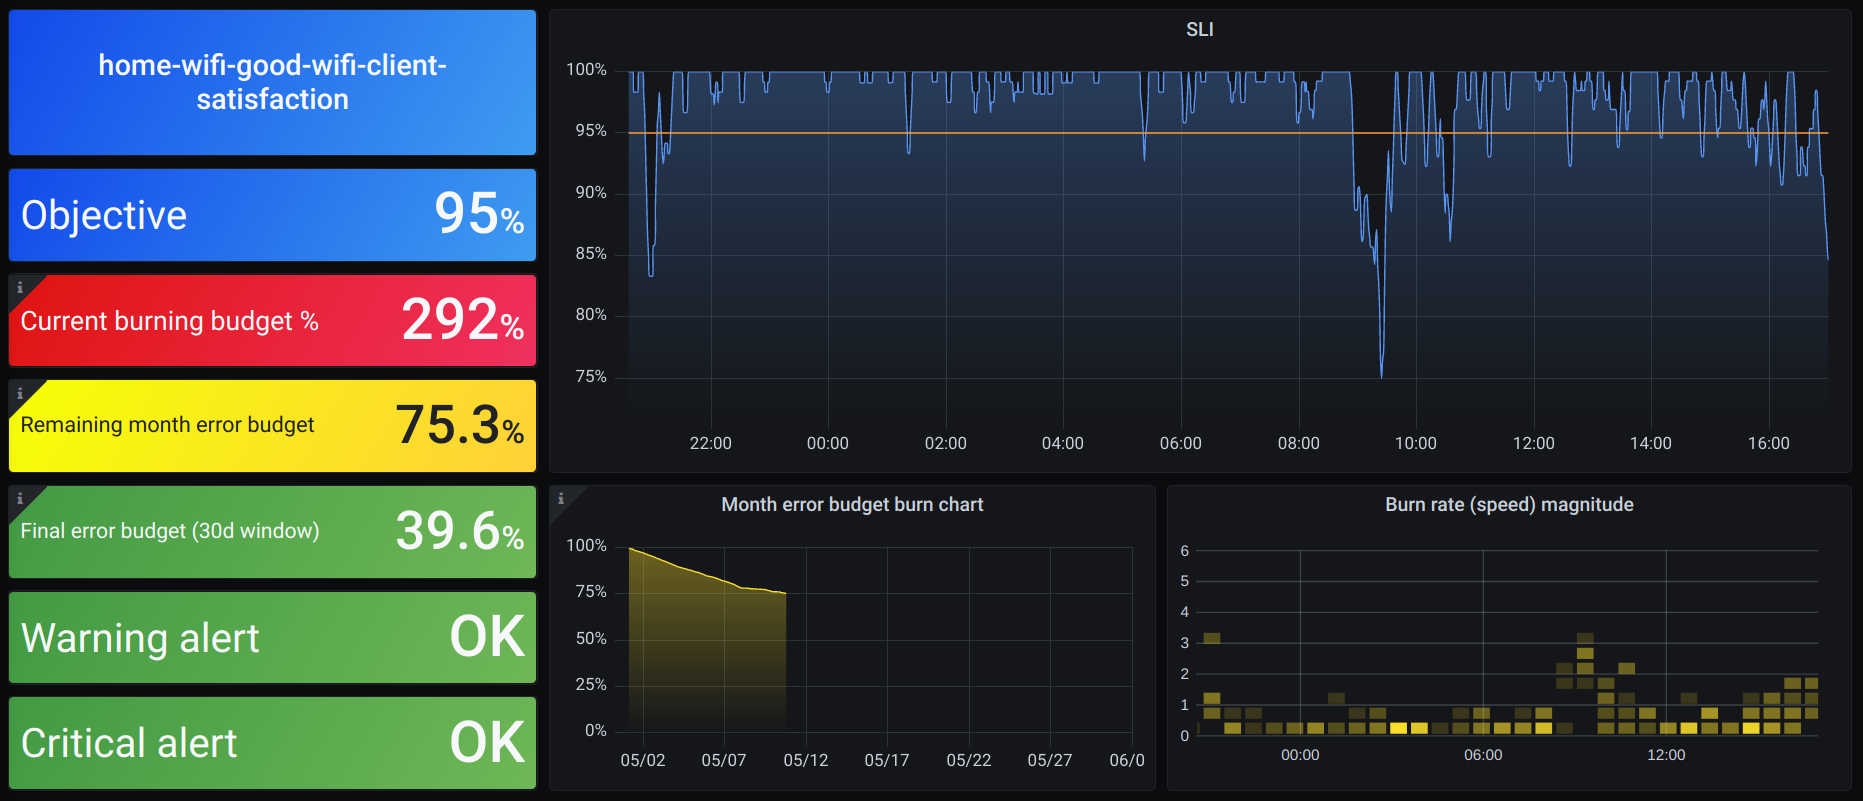
- Automatic Grafana dashboard to see all your SLOs state.
- Single binary and easy to use CLI.
- Kubernetes (Prometheus-operator) support.
- Kubernetes Controller/operator mode with CRDs.
- Support different SLI types.
- Support for SLI plugins
- A library with common SLI plugins.
- OpenSLO support.
- Safe SLO period windows for 30 and 28 days by default.
- Customizable SLO period windows for advanced use cases.
Release the Sloth!
sloth generate -i ./examples/getting-started.ymlversion: "prometheus/v1"
service: "myservice"
labels:
owner: "myteam"
repo: "myorg/myservice"
tier: "2"
slos:
# We allow failing (5xx and 429) 1 request every 1000 requests (99.9%).
- name: "requests-availability"
objective: 99.9
description: "Common SLO based on availability for HTTP request responses."
labels:
category: availability
sli:
events:
error_query: sum(rate(http_request_duration_seconds_count{job="myservice",code=~"(5..|429)"}[{{.window}}]))
total_query: sum(rate(http_request_duration_seconds_count{job="myservice"}[{{.window}}]))
alerting:
name: "MyServiceHighErrorRate"
labels:
category: "availability"
annotations:
# Overwrite default Sloth SLO alert summmary on ticket and page alerts.
summary: "High error rate on 'myservice' requests responses"
page_alert:
labels:
severity: "pageteam"
routing_key: "myteam"
ticket_alert:
labels:
severity: "slack"
slack_channel: "#alerts-myteam"This would be the result you would obtain from the above spec example.
Check the docs to know more about the usage, examples, and other handy features!
Looking for common SLI plugins? Check this repository, if you are looking for the sli plugins docs, check this instead.
Check CONTRIBUTING.md.

