-
Notifications
You must be signed in to change notification settings - Fork 131
New issue
Have a question about this project? Sign up for a free GitHub account to open an issue and contact its maintainers and the community.
By clicking “Sign up for GitHub”, you agree to our terms of service and privacy statement. We’ll occasionally send you account related emails.
Already on GitHub? Sign in to your account
Add plots to tutorials #25
Conversation
| "name": "stderr", | ||
| "output_type": "stream", | ||
| "text": [ | ||
| "/Users/mukadam/opt/anaconda3/envs/theseus/lib/python3.7/site-packages/theseus/optimizer/nonlinear/nonlinear_optimizer.py:191: RuntimeWarning: There was an error while running the linear optimizer. Original error message: cholesky_cpu: For batch 0: U(1,1) is zero, singular U..\n", |
There was a problem hiding this comment.
Choose a reason for hiding this comment
The reason will be displayed to describe this comment to others. Learn more.
There seems to be a weird behavior when running T1 with python 3.7 where the optimization is singular, so step 3 and robust curve fitting don't succeed. This issue goes away when run on python 3.8.
For now I reran both T1 and T2 with 3.8. We should look into this in a separate PR, @luisenp @vshobha.
There was a problem hiding this comment.
Choose a reason for hiding this comment
The reason will be displayed to describe this comment to others. Learn more.
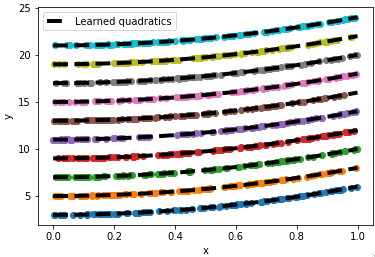
Looks good. Thanks for adding the visualizations, @bamos.
* Add plots to tutorials

* add semicolon to stop spurious matplotlib prints; fix typo; rerun all cells

* rerun tutorials 1 and 2 with python 3.8

Co-authored-by: Mustafa Mukadam <[email protected]>
This PR adds some plots to tutorials 1 and 2 to help visualize the data and functions that are being learned, e.g:
